
Search the Community
Showing results for tags 'march 2018'.
Found 18 results
-
Volvo Cars of North America, LLC - Up 53.7% (8,233 Vehicles Sold This Month, 20,083 Vehicles Sold This Year) Mazda North American Operations - Up 35.7% (33,302 Vehicles Sold This Month, 83,995 Vehicles Sold This Year) Mitsubishi Motors North America - Up 21.7% (14,319 Vehicles Sold This Month, 35,772 Vehicles Sold This Year) Volkswagen of America - Up 17.8% (32,548 Vehicles Sold This Month, 83,952 Vehicles Sold This Year) General Motors Co. - Up 15.7% (296,341 Vehicles Sold This Month, 715,794 Vehicles Sold This Year) FCA US LLC - Up 14% (216,063 Vehicles Sold This Month, 514,769 Vehicles Sold This Year) Jaguar Land Rover North America - Up 10% (14,232 Vehicles Sold This Month, 32,295 Vehicles Sold This Year) Audi of America - Up 7.4% (20,090 Vehicles Sold This Month, 50,052 Vehicles Sold This Year) Porsche Cars North America, Inc. - Up 6.2% (4,756 Vehicles Sold This Month, 13,954 Vehicles Sold This Year) Subaru of America, Inc. - Up 5.9% (58,097 Vehicles Sold This Month, 149,703 Vehicles Sold This Year) American Honda Motor Co. - Up 3.8% (142,392 Vehicles Sold This Month, 362,491 Vehicles Sold This Year) Toyota Motor North America - Up 3.5% (222,782 Vehicles Sold This Month, 572,033 Vehicles Sold This Year) Ford Motor Company - Up 3.4% (244,306 Vehicles Sold This Month, 599,581 Vehicles Sold This Year) Kia Motors America - Up 2.5% (50,645 Vehicles Sold This Month, 126,945 Vehicles Sold This Year) BMW Group U.S. - Down 0.4% (35,842 Vehicles Sold This Month, 84,368 Vehicles Sold This Year) Mercedes-Benz USA - Down 2.7% (31,484 Vehicles Sold This Month, 86,981 Vehicles Sold This Year) Nissan North America - Down 3.7% (162,535 Vehicles Sold This Month, 416,003 Vehicles Sold This Year) Hyundai Motor America - Down 11% (61,540 Vehicles Sold This Month, 148,877 Vehicles Sold This Year) Maserati North America, Inc. - Brands: Acura - Up 15.7% (13,537 Vehicles Sold This Month, 33,414 Vehicles Sold This Year) Alfa Romeo - Up 364% (2,576 Vehicles Sold This Month, 5,792 Vehicles Sold This Year) Audi - Up 7.4% (20,090 Vehicles Sold This Month, 50,052 Vehicles Sold This Year) BMW - Up 1% (31,311 Vehicles Sold This Month, 73,835 Vehicles Sold This Year) Buick - Up 28% (26,834 Vehicles Sold This Month, 56,804 Vehicles Sold This Year) Cadillac - Up 12.7% (14,494 Vehicles Sold This Month, 36,727 Vehicles Sold This Year) Chevrolet - Up 15.6% (199,367 Vehicles Sold This Month, 490,919 Vehicles Sold This Year) Chrysler - Up 15% (19,499 Vehicles Sold This Month, 46,233 Vehicles Sold This Year) Dodge - Down 2% (49,184 Vehicles Sold This Month, 116,971 Vehicles Sold This Year) Fiat - Down 47% (1,544 Vehicles Sold This Month, 4,014 Vehicles Sold This Year) Ford - Up 3.6% (234,954 Vehicles Sold This Month, 577,119 Vehicles Sold This Year) Genesis - Down 21% (1,386 Vehicles Sold This Month, 4,362 Vehicles Sold This Year) GMC - Up 11.4% (55,646 Vehicles Sold This Month, 131,344 Vehicles Sold This Year) Honda - Up 2.6% (128,855 Vehicles Sold This Month, 329,077 Vehicles Sold This Year) Hyundai - Down 10.9% (60,154 Vehicles Sold This Month, 144,515 Vehicles Sold This Year) Infiniti - Down 4.6% (17,432 Vehicles Sold This Month, 40,887 Vehicles Sold This Year) Jaguar - Down 34% (3,260 Vehicles Sold This Month, 8,049 Vehicles Sold This Year) Jeep - Up 45% (98,382 Vehicles Sold This Month, 228,105 Vehicles Sold This Year) Kia - Up 2.5% (50,645 Vehicles Sold This Month, 126,945 Vehicles Sold This Year) Land Rover - Up 38% (10,972 Vehicles Sold This Month, 24,246 Vehicles Sold This Year) Lexus - Down 3.2% (27,032 Vehicles Sold This Month, 64,211 Vehicles Sold This Year) Lincoln - Down 2.1% (9,352 Vehicles Sold This Month, 22,462 Vehicles Sold This Year) Maserati - Mazda - Up 35.7% (33,302 Vehicles Sold This Month, 83,995 Vehicles Sold This Year) Mercedes-Benz - Down 2.4% (28,407 Vehicles Sold This Month, 78,474 Vehicles Sold This Year) Mercedes-Benz Vans - Up 3.3% (2,967 Vehicles Sold This Month, 8,186 Vehicles Sold This Year) MINI - Down 9.1% (4,531 Vehicles Sold This Month, 10,533 Vehicles Sold This Year) Mitsubishi - Up 21.7% (14,319 Vehicles Sold This Month, 35,772 Vehicles Sold This Year) Nissan - Down 3.6% (145,103 Vehicles Sold This Month, 375,116 Vehicles Sold This Year) Porsche - Up 6.2% (4,756 Vehicles Sold This Month, 13,954 Vehicles Sold This Year) Ram Trucks - Down 13% (44,878 Vehicles Sold This Month, 113,654 Vehicles Sold This Year) Smart - Down 71.7% (110 Vehicles Sold This Month, 321 Vehicles Sold This Year) Subaru - Up 5.9% (58,097 Vehicles Sold This Month, 149,703 Vehicles Sold This Year) Toyota - Up 4.5% (195,750 Vehicles Sold This Month, 507,822 Vehicles Sold This Year) Volkswagen - Up 17.8% (32,548 Vehicles Sold This Month, 83,952 Vehicles Sold This Year) Volvo - Up 53.7% (8,233 Vehicles Sold This Month, 20,083 Vehicles Sold This Year) View full article
-
 Volvo Cars of North America, LLC - Up 53.7% (8,233 Vehicles Sold This Month, 20,083 Vehicles Sold This Year) Mazda North American Operations - Up 35.7% (33,302 Vehicles Sold This Month, 83,995 Vehicles Sold This Year) Mitsubishi Motors North America - Up 21.7% (14,319 Vehicles Sold This Month, 35,772 Vehicles Sold This Year) Volkswagen of America - Up 17.8% (32,548 Vehicles Sold This Month, 83,952 Vehicles Sold This Year) General Motors Co. - Up 15.7% (296,341 Vehicles Sold This Month, 715,794 Vehicles Sold This Year) FCA US LLC - Up 14% (216,063 Vehicles Sold This Month, 514,769 Vehicles Sold This Year) Jaguar Land Rover North America - Up 10% (14,232 Vehicles Sold This Month, 32,295 Vehicles Sold This Year) Audi of America - Up 7.4% (20,090 Vehicles Sold This Month, 50,052 Vehicles Sold This Year) Porsche Cars North America, Inc. - Up 6.2% (4,756 Vehicles Sold This Month, 13,954 Vehicles Sold This Year) Subaru of America, Inc. - Up 5.9% (58,097 Vehicles Sold This Month, 149,703 Vehicles Sold This Year) American Honda Motor Co. - Up 3.8% (142,392 Vehicles Sold This Month, 362,491 Vehicles Sold This Year) Toyota Motor North America - Up 3.5% (222,782 Vehicles Sold This Month, 572,033 Vehicles Sold This Year) Ford Motor Company - Up 3.4% (244,306 Vehicles Sold This Month, 599,581 Vehicles Sold This Year) Kia Motors America - Up 2.5% (50,645 Vehicles Sold This Month, 126,945 Vehicles Sold This Year) BMW Group U.S. - Down 0.4% (35,842 Vehicles Sold This Month, 84,368 Vehicles Sold This Year) Mercedes-Benz USA - Down 2.7% (31,484 Vehicles Sold This Month, 86,981 Vehicles Sold This Year) Nissan North America - Down 3.7% (162,535 Vehicles Sold This Month, 416,003 Vehicles Sold This Year) Hyundai Motor America - Down 11% (61,540 Vehicles Sold This Month, 148,877 Vehicles Sold This Year) Maserati North America, Inc. - Brands: Acura - Up 15.7% (13,537 Vehicles Sold This Month, 33,414 Vehicles Sold This Year) Alfa Romeo - Up 364% (2,576 Vehicles Sold This Month, 5,792 Vehicles Sold This Year) Audi - Up 7.4% (20,090 Vehicles Sold This Month, 50,052 Vehicles Sold This Year) BMW - Up 1% (31,311 Vehicles Sold This Month, 73,835 Vehicles Sold This Year) Buick - Up 28% (26,834 Vehicles Sold This Month, 56,804 Vehicles Sold This Year) Cadillac - Up 12.7% (14,494 Vehicles Sold This Month, 36,727 Vehicles Sold This Year) Chevrolet - Up 15.6% (199,367 Vehicles Sold This Month, 490,919 Vehicles Sold This Year) Chrysler - Up 15% (19,499 Vehicles Sold This Month, 46,233 Vehicles Sold This Year) Dodge - Down 2% (49,184 Vehicles Sold This Month, 116,971 Vehicles Sold This Year) Fiat - Down 47% (1,544 Vehicles Sold This Month, 4,014 Vehicles Sold This Year) Ford - Up 3.6% (234,954 Vehicles Sold This Month, 577,119 Vehicles Sold This Year) Genesis - Down 21% (1,386 Vehicles Sold This Month, 4,362 Vehicles Sold This Year) GMC - Up 11.4% (55,646 Vehicles Sold This Month, 131,344 Vehicles Sold This Year) Honda - Up 2.6% (128,855 Vehicles Sold This Month, 329,077 Vehicles Sold This Year) Hyundai - Down 10.9% (60,154 Vehicles Sold This Month, 144,515 Vehicles Sold This Year) Infiniti - Down 4.6% (17,432 Vehicles Sold This Month, 40,887 Vehicles Sold This Year) Jaguar - Down 34% (3,260 Vehicles Sold This Month, 8,049 Vehicles Sold This Year) Jeep - Up 45% (98,382 Vehicles Sold This Month, 228,105 Vehicles Sold This Year) Kia - Up 2.5% (50,645 Vehicles Sold This Month, 126,945 Vehicles Sold This Year) Land Rover - Up 38% (10,972 Vehicles Sold This Month, 24,246 Vehicles Sold This Year) Lexus - Down 3.2% (27,032 Vehicles Sold This Month, 64,211 Vehicles Sold This Year) Lincoln - Down 2.1% (9,352 Vehicles Sold This Month, 22,462 Vehicles Sold This Year) Maserati - Mazda - Up 35.7% (33,302 Vehicles Sold This Month, 83,995 Vehicles Sold This Year) Mercedes-Benz - Down 2.4% (28,407 Vehicles Sold This Month, 78,474 Vehicles Sold This Year) Mercedes-Benz Vans - Up 3.3% (2,967 Vehicles Sold This Month, 8,186 Vehicles Sold This Year) MINI - Down 9.1% (4,531 Vehicles Sold This Month, 10,533 Vehicles Sold This Year) Mitsubishi - Up 21.7% (14,319 Vehicles Sold This Month, 35,772 Vehicles Sold This Year) Nissan - Down 3.6% (145,103 Vehicles Sold This Month, 375,116 Vehicles Sold This Year) Porsche - Up 6.2% (4,756 Vehicles Sold This Month, 13,954 Vehicles Sold This Year) Ram Trucks - Down 13% (44,878 Vehicles Sold This Month, 113,654 Vehicles Sold This Year) Smart - Down 71.7% (110 Vehicles Sold This Month, 321 Vehicles Sold This Year) Subaru - Up 5.9% (58,097 Vehicles Sold This Month, 149,703 Vehicles Sold This Year) Toyota - Up 4.5% (195,750 Vehicles Sold This Month, 507,822 Vehicles Sold This Year) Volkswagen - Up 17.8% (32,548 Vehicles Sold This Month, 83,952 Vehicles Sold This Year) Volvo - Up 53.7% (8,233 Vehicles Sold This Month, 20,083 Vehicles Sold This Year)
 -
Chevrolet, Buick, GMC and Cadillac March Sales Surge 16 percent, Retail Share Climbs to 17.7 percent Chevrolet was the industry’s fastest-growing full-line brand on a retail basis Best March in GMC history New models drive a 41 percent jump in crossover sales Three-truck pickup strategy delivers again with sales up 19 percent Commercial sales rise 19 percent in March, up 27 percent in the first quarter DETROIT — General Motors (NYSE: GM) today reported 296,341 car, crossover and truck deliveries in the United States in March. Sales were up 16 percent year over year, driven by Buick’s best March since 2004, Chevrolet’s best March since 2007 and Cadillac’s best March since 2014. It was GMC’s best March in the brand’s history. GM’s retail sales in March were up 14 percent year over year, and the company’s estimated retail market share was 17.7 percent – the highest since 2009 – driven by a 0.7 percentage point gain by Chevrolet. Chevrolet was the industry’s fastest-growing full-line brand. In the first quarter, GM sales were up 4 percent, ahead of an estimated industry increase of about 2 percent. Retail deliveries for GM and the industry were up about 1 percent versus a year ago. “March was an exceptional month for us. A growing economy and strong new products helped us execute a very successful plan to conquest customers from other brands,” said Kurt McNeil, U.S. vice president, Sales Operations. “Once customers purchase a GM product, they tend to stay in the family as we deliver an award-winning ownership experience that is hard to beat.” In January, IHS Markit recognized General Motors as the company with the highest overall customer loyalty for the third consecutive year. Also in January, Buick was named the highest-ranked mass-market brand in the inaugural J.D. Power Total Ownership Experience Award. In March, Chevrolet was named J.D. Power’s most awarded brand of 2017. Six different Chevrolet cars, trucks and SUVs won a total of nine awards in the 2017 Vehicle Dependability, Initial Quality and APEAL studies. In the 2018 J.D. Power Customer Service Index (CSI) Study, Buick ranked highest in satisfaction for dealer service among mass market brands for the second consecutive year. Chevrolet tied for second place, followed by GMC. Cadillac is in the top three among luxury brands. March and First Quarter Sales Highlights (vs. 2017) Crossovers, pickups, SUVs, and six different car lines drove GM’s growth: Chevrolet crossovers were up 39 percent, with the Trax and the all-new Equinox and Traverse seeing their best March sales ever. Bolt EV deliveries reached 1,774 units. In the first quarter, Chevrolet crossovers were up 28 percent. Buick crossovers were up 50 percent. It was the Encore’s best month ever, and it was the Envision’s best March. The Enclave posting a 6 percent increase. In the first quarter, Buick crossovers were up 17 percent. GMC crossovers were up 42 percent, led by the best March ever for the Acadia and the best month ever for Terrain. In the first quarter, GMC crossovers were up 21 percent. Cadillac’s XT5 was up 17 percent in March, and 10 percent for the quarter. Cadillac cars deliveries were up 7 percent in March and for the first quarter, with every nameplate posting higher sales in March. The Cadillac Escalade was up 14 percent in March and 8 percent for the first quarter. Despite new competition, Escalade’s retail sales were up 15 percent in March and 12 percent in the first quarter, transaction prices continue to grow and retail market share is estimated to be up 2 percentage points year to date. The company’s three-truck pickup strategy delivered again, with sales up 19 percent in March, led by a 24 percent gain for the Chevrolet Silverado, a 52 percent gain for the Chevrolet Colorado and a 9 percent gain for the GMC Canyon. In the first quarter, pickup deliveries were up more than 2 percent. Chevrolet and GMC led the large SUV segment once again in March. Sales were up 4 percent in total and 13 percent on a retail basis, and retail segment share was more than 70 percent, according to J.D. Power PIN estimates. In the first quarter, large SUV total sales were in line with a year ago. Chevrolet’s Spark, Sonic and Malibu were strong sellers, up 2 percent, 16 percent and 3 percent, respectively. “Consumers are keeping the U.S. economy growing and auto sales very healthy,” said Mustafa Mohatarem, GM’s chief economist. “The job market is strong, consumer confidence is at decade-high levels and we see clear evidence that business owners are taking advantage of tax reform to upgrade their fleets.” GM’s Commercial deliveries rose 19 percent year over year in March and they were up 27 percent in the first quarter driven by higher pickup, crossover and Malibu sales. Rental deliveries were 11 percent of total sales for the month and the quarter, among the lowest levels in the industry. Other GM Highlights (vs. 2017) GM’s March average transaction prices (ATPs), which are net of incentives, were in line with a year ago, according to J.D. Power PIN estimates, and they were up more than $900 in the first quarter. GM’s incentive spending as a percentage of ATP was 14.5 percent in March, and 13.3 percent in the first quarter, according to J.D. Power PIN estimates. Spending was up less than one percentage point in March but down 0.8 points for the quarter. During the month, GM’s dealer inventory declined 16,602 units to a 72 days supply.

-
Mercedes-Benz USA reports March sales of 28,407 units Apr 3, 2018 – ATLANTA: Mercedes-Benz USA (MBUSA) today reported March sales of 28,407 units. Mercedes-Benz Vans reported March sales of 2,967 units (up 3.3%) and smart reported 110 units, bringing the MBUSA grand total to 31,484 vehicles for the month. On a year-to-date basis, Mercedes-Benz recorded sales of 78,474, adding 8,186 units for Vans and 321 vehicles for smart. MBUSA's year-to-date sales volume totaled 86,981 compared with 87,635 for the same period in 2017. "While winter storms in our Northeast region certainly impacted our totals, we continue to see strong gains for our GLC, GLA and S-Class model lines," said Dietmar Exler, president and CEO of MBUSA. "We expect strong SUV demand, combined with our diverse product line up, to help propel additional growth in the second quarter." Mercedes-Benz volume leaders in March included the GLC, C-Class and GLE model lines. The GLC took the lead at 6,064, followed by C-Class sales of 4,984. The GLE rounded out the top three with 4,573 units sold. Mercedes-AMG high-performance models sold 2,696 units in March, with a total of 7,619 units sold year-to-date. Mercedes-Benz Passenger Vehicles Mar-18 Mar-17 Monthly % YTD 2018 YTD 2017 Yearly % B-CLASS 33 50 -34.0% 122 159 -23.3% CLA 1,949 1,079 80.6% 5,455 4,010 36.0% C-CLASS 4,984 8,021 -37.9% 13,350 20,619 -35.3% E-CLASS/CLS 4,024 4,690 -14.2% 12,435 12,316 1.0% S-CLASS 1,627 1,434 13.5% 4,565 3,648 25.1% SLC 224 361 -38.0% 586 865 -32.3% SL 227 262 -13.4% 640 724 -11.6% AMG GT 114 103 10.7% 381 277 37.5% GLA 2,254 1,714 31.5% 6,524 5,915 10.3% GLC 6,064 3,126 94.0% 16,260 8,956 81.6% GLE 4,573 4,919 -7.0% 11,656 12,906 -9.7% GLS 1,974 2,938 -32.8% 5,496 7,741 -29.0% G-CLASS 360 395 -8.9% 1,004 1,005 -0.1% TOTAL 28,407 29,092 -2.4% 78,474 79,141 -0.8% Vans1 2,967 2,871 3.3% 8,186 7,433 10.1% smart 110 389 -71.7% 321 1,061 -69.7% MBUSA Combined Total Mar-18 Mar-17 Monthly % YTD 2018 YTD 2017 Yearly % GRAND TOTAL 31,484 32,352 -2.7% 86,981 87,635 -0.7% 1 Mercedes-Benz, Freightliner Sprinter and Metris Vans are sold and marketed in the U.S. by Mercedes-Benz USA and Daimler Vans USA, respectively.
- 4 replies
-
- 1
-

-
- march 2018
- mercedes-benz
- (and 3 more)
-
BMW Group U.S. Reports March 2018 Sales BMW Group sales decrease 0.4 percent in March 2018. BMW brand sales increase 1 percent. MINI brand sales decrease 9.1 percent. BMW Group electrified vehicle sales increase 71.1, accounting for 7.4 percent of total U.S. sales in March 2018. Woodcliff Lake, NJ – April 3, 2018… Sales of BMW brand vehicles increased 1 percent in March 2018 for a total of 31,311 compared to 31,015 vehicles sold in March 2017. Through Q1 2018, BMW brand sales are up 3.0 percent year-over-year. BMW brand sales in March 2018 were once again led by BMW’s lineup of Sports Activity Vehicles and the BMW 5 Series, which has shown strong growth for nine straight months. “It’s Spring and thoughts naturally turn to new cars with March giving us another uptick in sales – five months in a row – as the 5 Series continues to defy conventional thinking and proves there’s still a place in the market for a great sedan,” said Bernhard Kuhnt, President and CEO, BMW of North America. “At the same time, our X model lineup is expanding with the X2 now fully in the marketplace and Sports Activity Vehicles nearing 50% of our sales.” MINI Brand Sales For March, MINI USA reported 4,531 vehicles sold, a decrease of 9.1 percent from the 4,987 sold in the same month a year ago. BMW Group Sales In total, BMW Group in the U.S. (BMW and MINI combined) reported March 2018 sales of 35,842 vehicles, a decrease of 0.4 percent from the 36,002 vehicles sold in the same month a year ago. BMW Group Electrified Vehicle Sales BMW Group in the U.S. (BMW and MINI combined) sales of electric and plug-in hybrid electric vehicles totaled 2,662 in March 2018, an increase of 71.1 percent from the 1,556 sold in the same month a year ago. BMW Group electrified vehicles accounted for 7.4 percent of U.S. sales in March 2018.
-
Audi of America marks sales increase of 7.4 percent as the A5, Q5 and Q7 take the lead
-
Nissan Group reports March 2018 U.S. sales NASHVILLE, Tenn. – Nissan Group today announced total U.S. sales for March 2018 of 162,535 units, a decrease of 4% compared to the previous year. Nissan highlights: Nissan Rogue posted the best monthly performance in the nameplate's history with 42,151 sales, up 7%. Armada SUV sales rose 39% to 4,288 units, a March record. Frontier truck sales rose to 8,932 units, up 28%. Sentra compact sales increased 14% to 25,123 units. INFINITI today reported sales of 17,432 vehicles in the U.S. during March, down 5%. Deliveries of the all-new 2019 QX50, powered by the world’s first variable compression engine, began in March, contributing to the luxury crossover’s best March, with 1,913 total sold, up 11%. The Q50 sports sedan increased 34% to 5,085 in March, up 12% for the year. Overall INFINITI sedans and coupes were up 2.6% in March. The updated QX80 premium full-size SUV also had its best March, with an increase of 5%. The QX60 premium crossover had an all-time sales record of 5,115 delivered, up 34% in March and 39% for the year. NISSAN DIVISION MAR MAR Monthly CYTD CYTD CYTD 2018 2017 % chg 2018 2017 % chg Nissan Division Total 145,103 150,566 -3.6 375,116 373,330 0.5 Versa 10,921 12,336 -11.5 25,365 31,075 -18.4 Sentra 25,123 21,960 14.4 60,002 51,414 16.7 Altima 23,518 28,511 -17.5 63,406 73,985 -14.3 Maxima 5,034 6,961 -27.7 13,754 15,597 -11.8 LEAF 1,500 1,478 1.5 2,545 3,287 -22.6 Juke 142 1,487 -90.5 456 4,088 -88.8 370Z 447 500 -10.6 983 1,248 -21.2 GT-R 66 75 -12.0 135 195 -30.8 Total Car 66,751 73,308 -8.9 166,646 180,889 -7.9 Frontier 8,932 6,973 28.1 22,825 15,566 46.6 Titan 4,912 5,539 -11.3 12,724 11,295 12.7 Xterra 0 1 -100.0 0 1 -100.0 Pathfinder 6,680 10,442 -36.0 18,106 26,720 -32.2 Armada 4,288 3,094 38.6 9,082 7,291 24.6 Rogue 42,151 39,512 6.7 116,454 101,421 14.8 Murano 7,751 7,317 5.9 20,722 17,249 20.1 Quest 0 620 -100.0 2 3,870 -99.9 NV 1,606 1,863 -13.8 3,768 4,533 -16.9 NV200 2,032 1,897 7.1 4,787 4,495 6.5 Total Truck 78,352 77,258 1.4 208,470 192,441 8.3 INFINITI MAR MAR Monthly CYTD CYTD CYTD 2018 2017 % chg 2018 2017 % chg Infiniti Total 17,432 18,266 -4.6 40,887 43,561 -6.1 Infiniti Q50 5,085 3,800 33.8 11,701 10,450 12.0 Infiniti Q60 1,136 1,829 -37.9 2,603 3,371 -22.8 Infiniti Q70 655 1,072 -38.9 1,491 1,962 -24.0 Infiniti QX30 1,227 2,960 -58.5 2,815 6,532 -56.9 Infiniti QX50 1,913 1,724 11.0 4,084 4,318 -5.4 Infiniti QX60 5,115 3,821 33.9 12,024 8,668 38.7 Infiniti QX70 221 1,077 -79.5 570 2,905 -80.4 Infiniti QX80 2,080 1,983 4.9 5,599 5,355 4.6 Total Car 6,876 6,701 2.6 15,795 15,783 0.1 Total Truck 10,556 11,565 -8.7 25,092 27,778 -9.7 NISSAN GROUP MAR MAR Monthly CYTD CYTD CYTD 2018 2017 % chg 2018 2017 % chg TOTAL VEHICLE 162,535 168,832 -3.7 416,003 416,891 -0.2 Total Car 73,627 80,009 -8.0 182,441 196,672 -7.2 Total Truck 88,908 88,823 0.1 233,562 220,219 6.1 Selling days 28 27 77 75 # # #
-
 MITSUBISHI MOTORS REPORTS MARCH 2018 SALES UP 21.7 PERCENT Best March sales for the brand since 2005 Outlander Sport and Outlander both record their best March sales month ever Calendar year sales up 22.7 percent over 2017 CYPRESS, Calif. – Mitsubishi Motors North America, Inc. (MMNA) reported March 2018 sales of 14,319 units sold, up 21.7 percent over March 2017, its best March sales month since 2005. For the calendar year, total sales reported are 35,772, up 22.7 percent over the same period in 2017. The month was highlighted by Outlander Sport sales, which reported its best March ever. Outlander Sport sales were up 74.7 percent over March 2017 with 4,674 units sold. The popular Outlander also posted its best March ever with 4,789 units sold, up 13.1 percent over the same period in 2017. "Our CUV lineup is as strong as ever. We're confident in the competitiveness of our products and consumers are starting to realize one of the best kept secrets in the industry," said Ken Konieczka, vice president, sales operations, MMNA. "As supplies of our all-new Outlander PHEV and Eclipse Cross continue to grow, the sales momentum will only get stronger as we head into spring." March YTD 2018 2017 2018 2017 Mirage 3106 3324 5532 7470 Lancer 773 1528 2062 5221 Outlander Sport 4674 2676 13430 6864 Outlander 4789 4235 13099 9588 Outlander PHEV 373 0 996 0 Eclipse Cross 604 0 653 0 Total 14319 11766 35772 29147
 -
Volvo Reports March Sales ROCKLEIGH, N.J. (April 3, 2018) - Volvo Car USA, LLC, (VCUSA) reported U.S. sales of 8,233 vehicles for the month of March, an increase of 53.7 percent from the same period last year. For the first quarter of 2018, VCUSA sales were 20,083, an increase of 49.03 percent from the previous year. Recently announced as 2018 World Car of the Year, the new XC60 had its best month to date with 2,331 sales recorded. The top performing model in March was the XC90 with 2,796 sold, an increase of 67.3 percent compared to 2017. “We have had a very strong first quarter with nearly 50 percent increase in sales compared to 2017,” said Anders Gustafsson, President and CEO, Volvo Car USA. “We have the youngest product range in America, with three award-winning SUVs; the XC90, XC60 and XC40 which will continue to drive our growth in 2018.” The new XC40 launched in March and 1,001 have been sold during its first month of availability. Models March 2018 March 2017 % Year To Date 2018 Year To Date 2017 % S60 621 1,253 -50.4 % 2,029 2,908 -30.2 % S60 CC 13 10 30.0 % 114 40 185.0 % S80 0 0 - - 3 - S90 659 448 47.1 % 1,825 1,041 75.3 % V60 230 160 43.8 % 410 561 -26.9 % V60 CC 292 165 77.0 % 600 437 37.3 % V90 18 0 100.0 % 52 0 100.0 % V90 CC 224 98 128.6 % 552 135 308.9 % XC40 1,001 0 100.0 % 1,079 0 100.0 % XC60 48 1,544 -96.9 % 188 3,736 -95.0 % XC60 II 2,331 0 100.0 % 5,845 0 100.0 % XC70 0 7 - - 50 - All-New XC90 2,796 1,671 67.3 % 7,389 4,568 61.8 % Total 8,233 5,356 53.7 % 20,083 13,479 49.0 % * I, II, III etc shows which generation the car model belongs to.
-
Kia Motors America Announces March Sales Record-Setting Performance by the Sportage CUV Propels Kia to Highest March Sales Total Since 2016 IRVINE, Calif., April 3, 2018 – Kia Motors America today announced March sales of 50,645 vehicles, a 2.5-percent increase over the same period last year. The month was highlighted by best-ever March sales of the Sportage CUV, which were up more than 41-percent over the same period last year. In addition, four other Kia models realized significant increases in sales year-over-year, including the Cadenza and Rio, which were up 75.5- and 72.3-percent, respectively, and the Soul and Sorento models, which posted 5.0- and 3.6-percent gains. “Kia’s retail sales continue to climb with five models posting gains year-over-year, despite a 15.9-percent decrease in fleet sales,” said Bill Peffer, vice president, sales operations, Kia Motors America. “With Stinger sales rising and the Sportage CUV setting monthly sales records in each of first three months of the year, Kia enters the second quarter with tremendous momentum and several important new, high-volume products on the horizon, including the refreshed Sorento and all-new Forte sedan.” MONTH OF MARCH YEAR-TO-DATE Model 2018 2017 2018 2017 Rio 2,147 1,246 5,025 3,072 Forte 9,381 10,289 23,731 25,062 Optima 8,010 10,204 19,610 26,945 Cadenza 767 437 2,179 1,125 Stinger 1,555 N/A 3,920 N/A K900 37 43 91 108 Soul 8,849 8,426 21,418 23,920 Niro 2,478 2,704 6,335 4,889 Sportage 7,880 5,560 19,459 15,414 Sorento 8,027 7,751 21,386 20,775 Sedona 1,514 2,769 3,791 6,418 Total 50,645 49,429 126,945 127,728 # # #
-
Hyundai Motor America Reports March 2018 Sales FOUNTAIN VALLEY, Calif., April 3, 2018 – Hyundai Motor America reported March sales of Hyundai- and Genesis-branded vehicles of 61,540 units, an 11 percent decline in comparison with March 2017. Sales were paced by the best SUV sales month in company history, cracking 25,000 units for the first time and up 25 percent over last March. Inventories of the well-received Kona are increasing and dealers are turning them quickly. Tucson set its all-time monthly mark, up 31 percent, while setting a monthly record for 13 consecutive months. Not to be overlooked by Hyundai’s standout SUV performance, Sonata retails sales were up 16 percent. Sales by Brand Mar-18 Mar-17 2018 YTD 2017 YTD Hyundai 60,154 67,510 144,515 163,637 Genesis 1,386 1,755 4,362 5,155 TOTAL 61,540 69,265 148,877 168,792 Hyundai Brand Highlights “March was a balanced attack with Hyundai SUV sales representing 43 percent of total volume and Sonata gaining retail market share,” said John Angevine, director, National Sales, Hyundai Motor America. “We continue to focus on right sizing our business with emphasis on Hyundai core products and our SUV performance combined with Sonata’s retail gains is demonstrating that.” Hyundai Model Sales Vehicle Mar-18 Mar-17 2018 YTD 2017 YTD Accent 2,909 4,349 7,418 14,763 Azera 141 380 376 952 Elantra 17,323 25,063 47,064 54,202 Kona 2,360 0 2,559 0 Santa Fe 11,401 11,446 28,552 28,102 Sonata 11,098 15,357 23,825 37,869 Tucson 11,806 8,985 27,882 21,155 Veloster 1,445 1,386 3,040 5,548 Ioniq 1,669 327 3,798 332 Genesis Brand Highlights Genesis Motor America reported sales of 1,386 in March, a 21 percent decrease compared with the year earlier. “We are delighted that both March and Q1 sales performance are consistent with our expectations,” said Erwin Raphael, executive director and general manager, Genesis Motor America. “We are also absolutely thrilled with the reception both our all-new 2019 G70 Sport Sedan and our Essentia Concept are receiving at the New York International Auto Show. The G70 solidifies our sedan offerings as an attractive entry level luxury sedan with class leading interiors, safety technology and optimized driving dynamics. The G70 joins her mid-luxury G80 and premium luxury G90 siblings to form a solid foundation of athletically and elegantly designed, very well equipped luxury performance sedans.” Genesis Model Sales Vehicle Mar-18 Mar-17 2018 YTD 2017 YTD G80 1,049 1,347 3,378 3,952 G90 337 408 984 1,203
-
Ford SUVs Hit Record Sales Month – Retail Up; F-Series Posts Best Results Since 2000; All-New Expedition Retail Up 46 Percent, While Navigator Sees Triple-Digit Retail Gain
-
Subaru of America, Inc. Closes Out Best First Quarter Ever With Record March Sales CHERRY HILL, N.J., April 3, 2018 /PRNewswire/ -- Best March ever – monthly sales increase 5.9 percent over March 2017 76 consecutive months of yearly month-over-month growth Best March ever for Crosstrek and Outback Best month ever for Crosstrek 49 consecutive months of more than 10,000 Outbacks sold 56 consecutive months of more than 10,000 Foresters sold Subaru of America, Inc. today reported 58,097 vehicle sales for March 2018, a 5.9 percent increase over March 2017, and the best March in the history of the company. The automaker also reported year-to-date sales of 149,703 vehicles, a 3.8 percent gain over the same period in 2017. March marked the 49th consecutive month of 40,000+ vehicle sales for the automaker. Crosstrek and Outback sales were notably strong as each model achieved its best March ever. Outback sales for March 2018 increased 5.7 percent over the same month in 2017. Crosstrek sales for March 2018 increased 88.2 percent over the same month in 2017 and marked the first time that Crosstrek has topped 13,000 units in a month. Also in March, Subaru earned the ‘Most Trusted Brand’ for the fourth consecutive year in the 2018 Kelley Blue Book Brand Image Awards. The awards recognize automakers' impressive achievements in creating and maintaining brand attributes that capture the attention of the new-vehicle buying public and winners are chosen based on new car buyer perception data. “March and the first quarter of 2018 were both sales records for the Subaru franchise,” said Thomas J. Doll, president and chief executive officer of Subaru of America, Inc. “Our continuing record results are directly attributable to the passionate efforts of our retailers in delivering the best purchase, service and ownership experience possible to our valued customers.” “March marked another sales record, as well as the global debut of the all-new 2019 Forester at the New York International Auto Show,” said Jeff Walters, senior vice president of sales for Subaru of America. “Crosstrek set an all-time record in March while Outback set another monthly record. With the arrival of the all-new three-row Ascent later this summer Subaru’s SUV portfolio will continue to lead our success in a competitive industry. Carline Mar-18 Mar-17 % Chg Mar-18 Mar-17 % Chg MTD MTD MTD YTD YTD YTD Forester 14,616 15,803 -7.5% 37,104 41,476 -10.5% Impreza 5,973 7,653 -22.0% 16,454 18,584 -11.5% WRX/STI 3,028 3,050 -0.7% 7,191 7,690 -6.5% Legacy 3,889 4,897 -20.6% 10,496 12,703 -17.4% Outback 16,822 15,909 5.7% 44,122 42,572 3.6% BRZ 369 439 -16.0% 874 987 -11.5% Crosstrek 13,400 7,120 88.2% 33,462 20,238 65.3% TOTAL 58,097 54,871 5.9% 149,703 144,250 3.8%
-
VOLKSWAGEN OF AMERICA REPORTS MARCH 2018 SALES RESULTS Sales totaled 32,548 units, an increase of 17.8 percent compared to March 2017. Year-to-date sales totaled 83,952 units, an increase of 10 percent over 2017. Sales of the all-new 2018 Tiguan totaled 8,276 units; this marks the vehicle’s best month to date. Sales of the Chattanooga-built Atlas totaled 6,063 units. Herndon, VA — (April 3, 2018) Volkswagen of America, Inc. (VWoA) today reported sales of 32,548 units delivered in March 2018, an increase of 17.8 percent over March 2017. With 83,952 units delivered year-to-date in 2018, the company is reporting a 10 percent increase in year-over-year sales. March 2018 was the best month to date for the all-new 2018 Tiguan, with 8,276 units sold. The Chattanooga-built Atlas totaled 6,063 units sold. Overall, first quarter sales reflected the impact of Volkswagen’s move to offer a more family-friendly lineup, with SUVs accounting for more than 50 percent of total volume for the Volkswagen brand in year-over-year sales. Through the first quarter of 2017, SUVs made up only 14.4 percent of total sales for the brand. The all-new 2019 Jetta is expected to arrive at U.S. Volkswagen dealers in the second quarter of 2018. The Jetta is one of the world’s most successful sedans, with more than 17 million models sold worldwide, including more than 3.2 million of those vehicles in the U.S. The 2019 Jetta offers bolder design, more interior space and new technology. Later this year, Volkswagen will introduce the all-new Arteon sedan as the brand’s halo vehicle. March 2018 Sales March 18 March 17 Yr/Yr% change March 18 YTD March 17 YTD Yr/Yr% change Golf 913 1,035 -11.8% 1,913 3,342 -42.8% GTI 1,821 2,010 -9.4% 5,126 5,605 -8.5% Golf R 346 521 -33.6% 349 1,461 -76.1% e-Golf 164 342 -52.0% 540 967 -44.2% Golf SportWagen 1,626 2,461 -33.9% 4,084 6,602 -38.1% Total Golf Family 4,870 6,369 -23.5% 12,012 17,977 -33.2% Jetta Sedan 5,512 9,700 -43.2% 14,610 24,563 -40.5% Jetta SportWagen (now Golf SportWagen) 15 N/A N/A 40 N/A N/A Total Jetta 5,527 9,700 -43.0% 14,650 24,563 -40.4% Beetle Coupe 1,155 780 48.1% 2,516 2,364 6.4% Beetle Convertible 604 717 -15.8% 1,362 1,544 -11.8% Total Beetle 1,759 1,497 17.5% 3,878 3,908 -0.8% Passat 4,292 6,266 -31.5% 9,762 18,267 -46.6% CC 57 216 -73.6% 152 562 -73.0% Tiguan Limited 1,441 3,270 -55.9% 5,330 10,211 -47.8% 2018 Tiguan 8,276 N/A N/A 22,098 N/A N/A Touareg 263 317 -17.0% 938 802 17.0% Atlas 6,063 N/A N/A 15,132 N/A N/A TOTAL 32,548 27,635 17.8% 83,952 76,290 10.0%
-
Porsche Reports March 2018 U.S. Sales Porsche achieves strong Q1 with third consecutive monthly record in deliveries ATLANTA, April 3, 2018 /PRNewswire/ -- Porsche Cars North America, Inc. (PCNA), importer and distributor of the Porsche 911, 718 Boxster and Cayman, Panamera, Cayenne, and Macan model lines, today announced March 2018 sales of 4,756 vehicles. This represents a new all-time high for March and year-over-year growth of 6.2 percent. After record months in January and February, sales for the first quarter are up 9.7 percent from a year ago to 13,954 vehicles. "We are pleased to see such a strong customer response for the first three months of the year, especially for our Porsche 911, the 718 model line and the new generation Panamera," said Klaus Zellmer, President and CEO of PCNA. "Overall, this is an excellent first quarter for Porsche in the United States." March growth leaders were the Porsche 911, up 35.4 percent year-over-year, and the 718 Boxster and Cayman, which combined grew 45.1 percent from March 2017. Panamera sales rose 27.1 percent from a year ago, when the current generation model line went on sale. Model March Sales Year-to-Date 2018 2017 2018 2017 ALL 911 883 652 2,511 2,018 ALL 718 489 337 1,352 1,106 ALL PANAMERA 704 554 1,916 617 ALL CAYENNE 934 1,134 3,287 3,640 ALL MACAN 1,746 1,802 4,888 5,337 GRAND TOTALS 4,756 4,479 13,954 12,718
-
Toyota Motor North America Reports March 2018, First Quarter Sales Toyota division had its best first-quarter in 10 years Best-ever March sales for light truck, RAV4, Highlander Lexus luxury utility vehicles (LUVS) mark best-ever first quarter PLANO, Texas, April 3, 2018 /PRNewswire/ -- Toyota Motor North America (TMNA) today reported March 2018 sales of 222,782 vehicles, an increase of 3.5 percent from March 2017 on a volume basis. With one more selling day in March 2018 compared to March 2017, sales were down 0.2 percent on a daily selling rate (DSR) basis. Toyota division posted March sales of 195,750 units, up 4.5 percent on a volume basis and up 0.8 percent on a DSR basis. For the first quarter, Toyota posted sales of 572,033 units, up 7.4 percent on a volume basis and up 4.6 percent on a DSR basis. "Strong Camry sales in March, combined with continuing record light truck results, paved the way to our best first-quarter in 10 years," said Jack Hollis, group vice president and general manager, Toyota Division. "With the all-new Avalon and Corolla Hatchback on sale this spring, we're heading into the second quarter with confidence that our sales momentum will continue." Lexus posted March sales of 27,032 vehicles, down 3.2 percent on a volume basis and down 6.7 percent on a DSR basis. For the first quarter, Lexus posted sales of 64,211 units, up 3.8 percent on a volume basis and up 1.1 percent on a DSR basis. "Lexus turned in a solid first quarter with a nearly 4.0 percent sales increase year-over-year," said Jeff Bracken, group vice president and general manager, Lexus division. "Our success was fueled by strong demand for our LUVs, like the compact NX and new three-row RXL, combined with the launch of our new flagship LS sedan. And with even more products on the way, like the all-new UX that we just launched in New York, Lexus has great momentum heading into the rest of 2018." March 2018 Highlights TMNA, Toyota and Lexus divisions, posted best-ever March and first quarter light truck sales Toyota division posted quarterly sales of more than 507,000, its best first quarter in 10 years Toyota division SUVs up 17.5 percent with 74,662 units sold Camry posted sales of 35,264, outselling top-performing RAV4 RAV4 posted sales of 34,937 units, a best-ever month and first-quarter Highlander posted sales of 21,438 units, a best-ever March and first-quarter Toyota division pickups increased 18.6 percent Tacoma sales up 21.1 percent with 20,250 units sold Tundra posted sales of 10,697 units, up 14.3 percent Lexus division LUVs up 2.1 percent, a best-ever March NX Hybrid up 156.8 percent in March, a best-ever March RX posted monthly sales of 9,814 units LX sales up 3.1 percent Lexus LS posted sales of 1,008 units, up 172.4 percent *Note: Unless otherwise stated, all figures reflect unadjusted raw sales volume TOYOTA U.S. SALES SUMMARY MARCH 2018 -- CURRENT MONTH -- -- CALENDAR YEAR TO DATE -- 2018 2017 DSR % VOL % 2018 2017 DSR % VOL % TOTAL TOYOTA 222,782 215,224 -0.2 3.5 572,033 532,611 4.6 7.4 TOTAL TOYOTA DIV 195,750 187,289 0.8 4.5 507,822 470,766 5.1 7.9 TOTAL LEXUS 27,032 27,935 -6.7 -3.2 64,211 61,845 1.1 3.8 YARIS IA (INCL SCI IA) 2,918 4,083 -31.1 -28.5 7,506 8,835 -17.2 -15.0 YARIS LIFTBACK 144 1377 -89.9 -89.5 454 3,764 -88.3 -87.9 TOTAL YARIS 3,062 5,460 -45.9 -43.9 7,960 12,599 -38.5 -36.8 iQ 0 0 0 0 0 0 0 0.0 xD 0 0 0 0 0 0 0 0.0 xB 0 0 0 0 0 0 0 0.0 tC 0 31 -100.0 -100.0 1 142 -99.3 -99.3 COROLLA IM (INCL SCI IM) 2,147 2,123 -2.5 1.1 5,029 5,349 -8.4 -6.0 COROLLA SEDAN 29,245 30,584 -7.8 -4.4 72,791 76,086 -6.8 -4.3 TOTAL COROLLA 31,392 32,707 -7.4 -4.0 77,820 81,435 -6.9 -4.4 86 (INCL FR-S) 491 705 -32.8 -30.4 1,182 1,782 -35.4 -33.7 MIRAI 83 118 -32.2 -29.7 462 311 44.7 48.6 AVALON 4,068 3,483 12.6 16.8 10,576 8,596 19.8 23.0 PRIUS 8,222 9,761 -18.8 -15.8 22,235 26,634 -18.7 -16.5 CAMRY 35,264 35,648 -4.6 -1.1 90,767 83,459 5.9 8.8 TOTAL TOYOTA DIV. CAR 82,582 87,913 -9.4 -6.1 211,003 214,958 -4.4 -1.8 CT 1 841 -99.9 -99.9 4 1,692 -99.8 -99.8 IS 2,312 2,597 -14.2 -11.0 5,283 5,704 -9.8 -7.4 RC 271 619 -57.8 -56.2 618 1,561 -61.4 -60.4 ES 3,938 4,626 -17.9 -14.9 9,263 9,506 -5.1 -2.6 GS 754 737 -1.3 2.3 1,763 1,695 1.3 4.0 LS 1008 370 162.7 172.4 1,672 944 72.5 77.1 LC 218 0 0 0 522 0 0 0 LFA 0 0 0 0 1 0 0 0 TOTAL LEXUS CAR 8,502 9,790 -16.3 -13.2 19,126 21,102 -11.7 -9.4 TOTAL TOYOTA CAR 91,084 97,703 -10.1 -6.8 230,129 236,060 -5.0 -2.5 SIENNA 7,559 9,770 -25.4 -22.6 23,619 26,020 -11.6 -9.2 C-HR 5,253 0 0 0 13,619 0 0 0 RAV4 34,937 32,027 5.2 9.1 91,459 80,533 10.6 13.6 FJ CRUISER 0 2 -100 -100 1 2 -51.3 -50 VENZA 0 4 -100 -100 0 9 -100 -100 HIGHLANDER 21,438 18,058 14.5 18.7 52,882 46,642 10.4 13.4 4RUNNER 11,761 12,045 -5.8 -2.4 31,550 31,656 -2.9 -0.3 SEQUOIA 1,006 1,112 -12.8 -9.5 2,828 3,437 -19.9 -17.7 LAND CRUISER 267 272 -5.3 -1.8 764 796 -6.5 -4.0 TOTAL TOYOTA DIV. SUV 74,662 63,520 13.3 17.5 193,103 163,075 15.3 18.4 TACOMA 20,250 16,728 16.7 21.1 53,779 43,493 20.4 23.6 TUNDRA 10,697 9,358 10.2 14.3 26,318 23,220 10.4 13.3 TOTAL TOYOTA DIV. PICKUP 30,947 26,086 14.4 18.6 80,097 66,713 16.9 20.1 TOTAL TOYOTA DIV. TRUCK 113,168 99,376 9.8 13.9 296,819 255,808 13.0 16.0 NX 5,859 5,619 0.5 4.3 14,327 12,097 15.4 18.4 RX 9,814 9,445 0.2 3.9 23,790 21,641 7.1 9.9 GX 2329 2569 -12.6 -9.3 5,691 5,514 0.5 3.2 LX 528 512 -0.6 3.1 1,277 1,491 -16.6 -14.4 TOTAL LEXUS TRUCK 18,530 18,145 -1.5 2.1 45,085 40,743 7.8 10.7 TOTAL TOYOTA TRUCK 131,698 117,521 8.1 12.1 341,904 296,551 12.3 15.3 Selling Days 28 27 77 75 DSR = Daily Selling Rate *NA Built Vehicles TOYOTA U.S. SALES SUMMARY MARCH, 2018 -- CURRENT MONTH -- -- CALENDAR YEAR TO DATE -- 2018 2017 DSR % VOL % 2018 2017 DSR % VOL % COROLLA 29,245 30,584 -7.8 -4.4 72,791 76,086 -6.8 -4.3 CAMRY 33,235 35,648 -10.1 -6.8 82,164 83,459 -4.1 -1.6 AVALON 4,068 3,483 12.6 16.8 10,576 8,596 19.8 23.0 YARIS IA (INCL SCI IA) 2,918 4,083 -31.1 -28.5 7,506 8,835 -17.2 -15.0 RAV4 14,622 15,552 -9.3 -6.0 41,184 38,639 3.8 6.6 VENZA 0 4 -100.0 -100.0 0 9 -100.0 -100.0 HIGHLANDER 21,438 18,058 14.5 18.7 52,882 46,642 10.4 13.4 SIENNA 7,559 9,770 -25.4 -22.6 23,619 26,020 -11.6 -9.2 SEQUOIA 1,006 1,112 -12.8 -9.5 2,828 3,437 -19.9 -17.7 TACOMA 20,250 16,728 16.7 21.1 53,779 43,493 20.4 23.6 TUNDRA 10,697 9,358 10.2 14.3 26,318 23,220 10.4 13.3 ES 3,507 3,502 -3.4 0.1 8,282 6,895 17.0 20.1 RX 8,198 8,745 -9.6 -6.3 21,004 19,983 2.4 5.1 TOTAL 156,743 156,627 -3.5 0.1 402,933 385,314 1.9 4.6 N.A VEHICLES % OF TOTAL 70.4% 72.8% 70.4% 72.3% TOYOTA DIV. IMPORT CAR 13,116 14,115 -10.4 -7.1 37,966 37,982 -2.6 0.0 LEXUS IMPORT CAR 4,995 6,288 -23.4 -20.6 10,844 14,207 -25.7 -23.7 TOYOTA DIV NA BUILT CARS 69,466 73,798 -9.2 -5.9 173,037 176,976 -4.8 -2.2 LEXUS NA BUILT CARS 3,507 3,502 -3.4 0.1 8,282 6,895 17.0 20.1 TOTAL TOYOTA CARS 91,084 97,703 -10.1 -6.8 230,129 236,060 -5.0 -2.5 TOYOTA DIV. IMPORT TRUCK 37,596 28,794 25.9 30.6 96,209 74,348 26.0 29.4 LEXUS IMPORT TRUCK 10,332 9,400 6.0 9.9 24,081 20,760 13.0 16.0 TOYOTA DIV NA BUILT TRUCK 75,572 70,582 3.2 7.1 200,610 181,460 7.7 10.6 LEXUS NA BUILT TRUCK 8,198 8,745 -9.6 -6.3 21,004 19,983 2.4 5.1 TOTAL TOYOTA TRUCK 131,698 117,521 8.1 12.1 341,904 296,551 12.3 15.3 Selling Days 28 27 77 78 DSR = Daily Selling Rate
-
Mazda Reports Sales Increase of 35.7 Percent in March Mazda CX-5 Posts Best-Ever Sales Month IRVINE, Calif., April 3, 2018 /PRNewswire/ -- Mazda North American Operations (MNAO) today reported total March U.S. sales of 33,302 vehicles, representing an increase of 35.7 percent versus March of last year. Year-to-date (YTD) sales through March are up 21.6 percent versus last year, with 83,995 vehicles sold. Key March sales notes: Mazda's compact crossover SUV, Mazda CX-5, recorded its 12th consecutive record sales month, and its best-ever month since going on sale in February of 2012. In March, sales of the CX-5 rose 90.5 percent year-over-year (YOY), with 16,138 vehicles sold. Sales of the Mazda3 rose 8.7 percent YOY, with 7,760 vehicles sold in the month of March. In line with continued consumer demand, sales of Mazda's subcompact crossover SUV, Mazda CX-3, rose 38.1 percent YOY, with 1,728 vehicles sold in the month of March. The seven-passenger Mazda CX-9 recorded its best March since 2013, with 3,066 vehicles sold. This number represents an increase of 20.2 percent YOY. Total sales of Mazda's CX crossover SUV line, including the CX-3, CX-5 and CX-9, were up 70.6 percent YOY with 20,932 vehicles sold in the month of March. The i-ACTIV All-Wheel Drive option continues to be a favorite among Mazda CX-line buyers, with 59.5 percent of customers choosing the AWD option in March. Mazda reported record-breaking Certified Pre-Owned (CPO) sales of 4,552 vehicles in March, marking an increase of 19.6 percent YOY. Month-To-Date Year-To-Date March March % % MTD March March % % YTD 2018 2017 Change DSR 2018 2017 Change DSR Mazda3 7,760 7,137 8.7% 4.8% 19,655 20,606 (4.6)% (7.1)% Mazda5 - 2 - - - 5 (100.0)% (100.0)% Mazda6 3,734 3,794 (1.6)% (5.1)% 7,532 10,692 (29.6)% (31.4)% MX-5 Miata 876 1,345 (34.9)% (37.2)% 1,966 3,382 (41.9)% (43.4)% CX-3 1,728 1,251 38.1% 33.2% 4,337 3,714 16.8% 13.7% CX-5 16,138 8,470 90.5% 83.7% 42,817 24,374 75.7% 71.1% CX-9 3,066 2,550 20.2% 15.9% 7,688 6,298 22.1% 18.9% Total Vehicles CARS 12,370 12,278 0.7% (2.8)% 29,153 34,685 (15.9)% (18.1)% TRUCKS 20,932 12,271 70.6% 64.5% 54,842 34,386 59.5% 55.3% TOTAL 33,302 24,549 35.7% 30.8% 83,995 69,071 21.6% 18.4% Selling Days 28 27 77 75
-
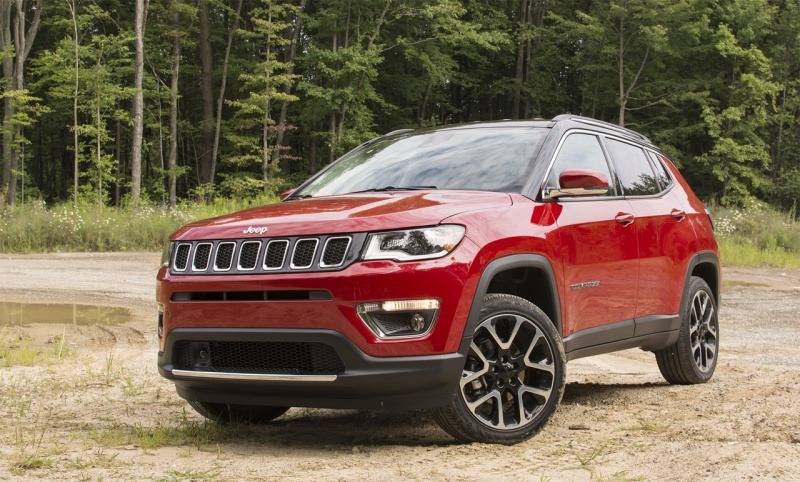
FCA US Reports 2018 March Sales FCA US reports best March retail sales in 17 years Jeep® brand reports best month of total sales ever Jeep Wrangler reports best month of total sales ever Ram Light Duty retail sales increased 8 percent April 3, 2018 , Auburn Hills, Mich. - FCA US LLC today reported March 2018 sales of 216,063 vehicles, a 14 percent increase compared with sales in March 2017 of 190,254 vehicles. The company reported retail sales of 162,304 vehicles, up 11 percent from March 2017. It was the best month of March retail sales since the company sold 170,545 vehicles in March 2001. Total sales were the highest since March 2006 when the company sold 216,865 vehicles. Fleet accounted for 25 percent of overall sales. Jeep® Brand Jeep brand total sales rose 45 percent in March to 98,382 vehicles for its best month ever. The Jeep Wrangler led the group as sales rose 70 percent to 27,829 vehicles. It was the best month of sales ever for the nameplate, eclipsing the May 2015 record of 22,615 vehicles. Jeep Cherokee sales increased 63 percent to 23,764 vehicles for its best March sales ever. Ram Truck Brand Ram Truck brand sales declined 13 percent to 44,878 vehicles compared with the previous year. However, retail sales of the Ram Light Duty pickup truck rose 8 percent to 26,050 vehicles. The new 2019 Ram 1500 pickup truck began shipping to dealers in the second half of the month. The truck is being produced at the Sterling Heights Assembly Plant in Michigan. Chrysler Brand Chrysler brand total sales rose 15 percent in March to 19,499 vehicles compared with the same month a year ago. The Chrysler Pacifica minivan posted a 40 percent sales increase while the Chrysler 300 rose 25 percent. Dodge Brand Dodge brand total sales declined 2 percent to 49,184. Sales of the Dodge Challenger rose 31 percent to 8,150 vehicles. FIAT Brand Sales of Fiat declined 47 percent to 1,544 vehicles. Alfa Romeo Brand Alfa Romeo brand sales of 2,576 vehicles were up significantly compared with the same month a year ago. Giulia led the brand with 1,284 sales followed by Stelvio at 1,270 vehicles. FCA US LLC Sales Summary March 2018 Month Sales Vol % CYTD Sales Vol % Model Curr Yr Pr Yr Change Curr Yr Pr Yr Change Compass 17,302 2,651 553% 43,520 8,552 409% Patriot 100 5,968 -98% 364 16,180 -98% Wrangler 27,829 16,336 70% 55,504 41,311 34% Cherokee 23,764 14,589 63% 50,610 40,755 24% Grand Cherokee 19,616 20,374 -4% 53,448 56,600 -6% Renegade 9,771 8,065 21% 24,659 25,345 -3% JEEP BRAND 98,382 67,983 45% 228,105 188,743 21% Ram P/U 41,307 46,384 -11% 103,964 119,199 -13% Cargo Van 0 0 0% 0 0 ProMaster Van 2,451 4,048 -39% 6,457 10,047 -36% ProMaster City 1,120 1,317 -15% 3,233 3,333 -3% RAM BRAND 44,878 51,749 -13% 113,654 132,579 -14% 200 189 2,565 -93% 659 6,620 -90% 300 6,223 4,969 25% 12,992 15,063 -14% Town & Country 1 95 -99% 3 341 -99% Pacifica 13,086 9,340 40% 32,579 25,052 30% CHRYSLER BRAND 19,499 16,969 15% 46,233 47,076 -2% Dart 87 1,578 -94% 252 4,658 -95% Avenger 0 0 100% 1 0 Charger 8,504 8,236 3% 21,265 22,319 -5% Challenger 8,150 6,225 31% 17,648 15,725 12% Viper 6 71 -92% 9 178 -95% Journey 10,275 11,858 -13% 18,419 34,400 -46% Caravan 16,292 15,602 4% 43,144 40,054 8% Durango 5,870 6,506 -10% 16,233 16,729 -3% DODGE BRAND 49,184 50,076 -2% 116,971 134,063 -13% 500 439 1,671 -74% 1,309 4,020 -67% 500L 173 106 63% 395 284 39% 500X 607 726 -16% 1,579 1,966 -20% Spider 325 419 -22% 731 961 -24% FIAT BRAND 1,544 2,922 -47% 4,014 7,231 -44% Giulia 1,284 484 165% 3,085 965 220% Alfa 4C 22 71 -69% 54 141 -62% Stelvio 1,270 0 New 2,653 0 New ALFA ROMEO 2,576 555 364% 5,792 1,106 424% FCA US LLC 216,063 190,254 14% 514,769 510,798 1% Total Car & MPV 54,781 51,432 7% 134,126 136,381 -2% Total UV's 116,404 87,073 34% 266,989 241,838 10% Total Truck & LCV 44,878 51,749 -13% 113,654 132,579 -14%


