
Search the Community
Showing results for tags 'J.D. Power'.
Found 10 results
-

 J.D. Power has announced the results of their inaugural Tech Experience Index (TXI) Study. The study focused on the experience of owners with a vehicle's technology features such as infotainment and safety during the first 90 days. The good news is the average satisfaction score was 730 out of a possible 1,000 points. But owners aren't impressed with their vehicle's navigation system. It earned the lowest average score of 687 in the study. More than half of the owners surveyed said they never even used the system, using the navigation function on their phones. Nearly a third who said they used the navigation system only used it for two weeks before resorting to their phones, citing issues with entering a new destination. Voice commands was also a pain point for many owners as the system didn't understand the commands and have to be repeated multiple times. “For any technology in a vehicle, it’s critical that the owners want it, are aware they have it and know how to use it. It is alarming how many technologies consumers have in their vehicle but aren’t using because they don’t know they have them or don’t know how to use them. Both of these knowledge gaps have long-term implications for future demand,” said Kristin Kolodge, executive director of driver interaction & HMI research at J.D. Power. On the flipside, owners really like collision avoidance technologies. Such features as a backup camera, blind spot warning, and lane keep assist earned the highest average score in the study of 754. Also, 96 percent of owners who have these safety features in their current vehicle want to have them in their next vehicle. Source: J.D. Power Press Release is on Page 2 Safety Technologies Have Highest Satisfaction; Navigation Lags DETROIT: 10 Oct. 2016 — BMW and Hyundai each have two models that rank highest in overall customer experience with vehicle technology in their respective segment, according to the J.D. Power 2016 U.S. Tech Experience Index (TXI) Study,SM released today. The inaugural study measures a vehicle owner’s experiences, usage and interaction with driver-centric vehicle technology at 90 days of ownership. The major technology categories analyzed in the study include collision protection; comfort and convenience; driving assistance; entertainment and connectivity; navigation; and smartphone mirroring. BMW models that rank highest in their segment1 are the 2 Series (small premium segment) and 4 Series (compact premium segment), while the Hyundai models that rank highest are the Genesis (midsize premium segment) and Tucson (small segment). Model-level rankings and awards include 2016 model-year vehicles that were all new or redesigned within the past three years. Other models that rank highest in their segment are the Chevrolet Camaro (midsize segment); Kia Forte (compact segment); and Nissan Maxima (large segment). Safety Technologies Reign Among the vast array of technologies available in new vehicles, those that assist with collision avoidance have the highest usage and the highest overall satisfaction. Additionally, they are the technologies owners most want in their next vehicle, according to the study. Collision avoidance technologies—such as blind spot warning and detection, lane-keeping/centering and back-up camera/warning systems—are collectively part of the collision protection category, which has the highest overall satisfaction among the five groups of technologies included in the study index scores, with a score of 754 on a 1,000-point scale. In contrast, owners are least satisfied with their navigation systems (687). “For any technology in a vehicle, it’s critical that the owners want it, are aware they have it and know how to use it,” said Kristin Kolodge, executive director of driver interaction & HMI research at J.D. Power. “It is alarming how many technologies consumers have in their vehicle but aren’t using because they don’t know they have them or don’t know how to use them. Both of these knowledge gaps have long-term implications for future demand.” Back-up camera/warning and blind spot warning and detection are the most often used technologies, with at least three-fourths of owners saying they use the technology every time they drive. Additionally, they are the most in-demand technologies, with 96% of current owners of the technologies saying they want each of the features in their next car. Other industries beyond automotive are keeping a close eye on in-vehicle technologies. For example, the insurance industry is closely tracking the use of safety-related technologies that, while potentially increasing claims costs when a vehicle is damaged, also help prevent or mitigate collisions and protect occupants when there is an accident. Auto insurers have been slow to add discounts for newer safe driver technologies, but that is beginning to change. Liberty Mutual Insurance offers a vehicle safety discount for teens driving a vehicle equipped with safety features, such as a lane departure warning system; adaptive cruise control; and collision preparation systems.2 “As auto insurers begin to offer discounts for vehicle safety features, this may help raise consumer awareness that they actually have these technologies and the knowledge to use them properly,” said Jessica McGregor, director of the insurance practice at J.D. Power. The Role of the Dealer Even if owners are aware they have an in-vehicle technology doesn’t mean they will use it. Among owners who say they never use a specific technology, 39% indicate they bring another device into their vehicle to replace certain technologies that are already present. Of those who bring in another device, navigation is the feature most often replaced. Furthermore, 57% of owners who bring in another device say they never used the in-vehicle equipment before bringing this outside device into the car to replace the vehicle’s features. Of the 43% who have used it, 56% stop using it within the first month. “The dealer plays a critical role in whether or not a technology is used,” said Kolodge. “When the dealer takes the time to explain the technology or provide a demonstration, it not only makes the owner aware they have the technology, but also helps them understand how to use it, which means they are more likely to use it, continue to use it and, because they see the value, want it in their next vehicle.” Among owners who learn how to operate the technologies from their dealer, overall satisfaction is 25-54 points higher, compared with those who learn how to operate the technologies from another source or from prior experience. Technologies that owners say are difficult to use (DTU) put a strain on satisfaction. Across all technologies, there is an average 98-point drop in satisfaction when owners have DTU issues. DTU problems not only deteriorate satisfaction, but they also affect the vehicle’s quality. Even though it may operate as intended, when a technology is difficult for an owner to use or understand, it is likely to be considered a quality issue. For example, navigation system difficult to use/poor location is the sixth most common problem in the J.D. Power 2016 U.S. Initial Quality StudySM (IQS). Owners who learn how to use their navigation system from the dealer report 2.0 problems per 100 vehicles (PP100) fewer navigation DTU problems than those who do not get a dealer explanation. “By taking the time to show the technology to the new owner, the dealer can mitigate DTU issues, improving both satisfaction and quality,” said Kolodge. “The navigation system is just one area. If the dealer explains all or many of the technologies to the new owner, it can have a dramatic positive effect on the ownership experience.” Gap between Premium and Non-Premium Is Narrow Overall owner satisfaction with new-vehicle technology averages 730. Satisfaction among premium vehicle owners is slightly higher at 734, compared with 730 among non-premium owners. Overall satisfaction varies greatly by segment. Satisfaction is highest in the large segment (755), followed by the small premium segment (735); compact premium segment (732); midsize premium segment (731); compact segment (727); midsize segment (725); and the small segment (706). “It’s not just how much technology you have in the vehicle, but how well it’s delivered,” said Kolodge. “The technology’s usability and how well it is integrated into the vehicle are critical—that has to be done right.” The 2016 U.S. Tech Experience Index (TXI) Study is based on a survey of 17,864 vehicle owners and lessees. Awards are based solely on responses from the 13,269 consumers who purchased or leased a new 2016 model-year vehicle in the previous 90 days that has been considered an all-new or redesigned vehicle within in the past three years. The study was fielded from February through August 2016.
 -
J.D. Power has announced the results of their inaugural Tech Experience Index (TXI) Study. The study focused on the experience of owners with a vehicle's technology features such as infotainment and safety during the first 90 days. The good news is the average satisfaction score was 730 out of a possible 1,000 points. But owners aren't impressed with their vehicle's navigation system. It earned the lowest average score of 687 in the study. More than half of the owners surveyed said they never even used the system, using the navigation function on their phones. Nearly a third who said they used the navigation system only used it for two weeks before resorting to their phones, citing issues with entering a new destination. Voice commands was also a pain point for many owners as the system didn't understand the commands and have to be repeated multiple times. “For any technology in a vehicle, it’s critical that the owners want it, are aware they have it and know how to use it. It is alarming how many technologies consumers have in their vehicle but aren’t using because they don’t know they have them or don’t know how to use them. Both of these knowledge gaps have long-term implications for future demand,” said Kristin Kolodge, executive director of driver interaction & HMI research at J.D. Power. On the flipside, owners really like collision avoidance technologies. Such features as a backup camera, blind spot warning, and lane keep assist earned the highest average score in the study of 754. Also, 96 percent of owners who have these safety features in their current vehicle want to have them in their next vehicle. Source: J.D. Power Press Release is on Page 2 Safety Technologies Have Highest Satisfaction; Navigation Lags DETROIT: 10 Oct. 2016 — BMW and Hyundai each have two models that rank highest in overall customer experience with vehicle technology in their respective segment, according to the J.D. Power 2016 U.S. Tech Experience Index (TXI) Study,SM released today. The inaugural study measures a vehicle owner’s experiences, usage and interaction with driver-centric vehicle technology at 90 days of ownership. The major technology categories analyzed in the study include collision protection; comfort and convenience; driving assistance; entertainment and connectivity; navigation; and smartphone mirroring. BMW models that rank highest in their segment1 are the 2 Series (small premium segment) and 4 Series (compact premium segment), while the Hyundai models that rank highest are the Genesis (midsize premium segment) and Tucson (small segment). Model-level rankings and awards include 2016 model-year vehicles that were all new or redesigned within the past three years. Other models that rank highest in their segment are the Chevrolet Camaro (midsize segment); Kia Forte (compact segment); and Nissan Maxima (large segment). Safety Technologies Reign Among the vast array of technologies available in new vehicles, those that assist with collision avoidance have the highest usage and the highest overall satisfaction. Additionally, they are the technologies owners most want in their next vehicle, according to the study. Collision avoidance technologies—such as blind spot warning and detection, lane-keeping/centering and back-up camera/warning systems—are collectively part of the collision protection category, which has the highest overall satisfaction among the five groups of technologies included in the study index scores, with a score of 754 on a 1,000-point scale. In contrast, owners are least satisfied with their navigation systems (687). “For any technology in a vehicle, it’s critical that the owners want it, are aware they have it and know how to use it,” said Kristin Kolodge, executive director of driver interaction & HMI research at J.D. Power. “It is alarming how many technologies consumers have in their vehicle but aren’t using because they don’t know they have them or don’t know how to use them. Both of these knowledge gaps have long-term implications for future demand.” Back-up camera/warning and blind spot warning and detection are the most often used technologies, with at least three-fourths of owners saying they use the technology every time they drive. Additionally, they are the most in-demand technologies, with 96% of current owners of the technologies saying they want each of the features in their next car. Other industries beyond automotive are keeping a close eye on in-vehicle technologies. For example, the insurance industry is closely tracking the use of safety-related technologies that, while potentially increasing claims costs when a vehicle is damaged, also help prevent or mitigate collisions and protect occupants when there is an accident. Auto insurers have been slow to add discounts for newer safe driver technologies, but that is beginning to change. Liberty Mutual Insurance offers a vehicle safety discount for teens driving a vehicle equipped with safety features, such as a lane departure warning system; adaptive cruise control; and collision preparation systems.2 “As auto insurers begin to offer discounts for vehicle safety features, this may help raise consumer awareness that they actually have these technologies and the knowledge to use them properly,” said Jessica McGregor, director of the insurance practice at J.D. Power. The Role of the Dealer Even if owners are aware they have an in-vehicle technology doesn’t mean they will use it. Among owners who say they never use a specific technology, 39% indicate they bring another device into their vehicle to replace certain technologies that are already present. Of those who bring in another device, navigation is the feature most often replaced. Furthermore, 57% of owners who bring in another device say they never used the in-vehicle equipment before bringing this outside device into the car to replace the vehicle’s features. Of the 43% who have used it, 56% stop using it within the first month. “The dealer plays a critical role in whether or not a technology is used,” said Kolodge. “When the dealer takes the time to explain the technology or provide a demonstration, it not only makes the owner aware they have the technology, but also helps them understand how to use it, which means they are more likely to use it, continue to use it and, because they see the value, want it in their next vehicle.” Among owners who learn how to operate the technologies from their dealer, overall satisfaction is 25-54 points higher, compared with those who learn how to operate the technologies from another source or from prior experience. Technologies that owners say are difficult to use (DTU) put a strain on satisfaction. Across all technologies, there is an average 98-point drop in satisfaction when owners have DTU issues. DTU problems not only deteriorate satisfaction, but they also affect the vehicle’s quality. Even though it may operate as intended, when a technology is difficult for an owner to use or understand, it is likely to be considered a quality issue. For example, navigation system difficult to use/poor location is the sixth most common problem in the J.D. Power 2016 U.S. Initial Quality StudySM (IQS). Owners who learn how to use their navigation system from the dealer report 2.0 problems per 100 vehicles (PP100) fewer navigation DTU problems than those who do not get a dealer explanation. “By taking the time to show the technology to the new owner, the dealer can mitigate DTU issues, improving both satisfaction and quality,” said Kolodge. “The navigation system is just one area. If the dealer explains all or many of the technologies to the new owner, it can have a dramatic positive effect on the ownership experience.” Gap between Premium and Non-Premium Is Narrow Overall owner satisfaction with new-vehicle technology averages 730. Satisfaction among premium vehicle owners is slightly higher at 734, compared with 730 among non-premium owners. Overall satisfaction varies greatly by segment. Satisfaction is highest in the large segment (755), followed by the small premium segment (735); compact premium segment (732); midsize premium segment (731); compact segment (727); midsize segment (725); and the small segment (706). “It’s not just how much technology you have in the vehicle, but how well it’s delivered,” said Kolodge. “The technology’s usability and how well it is integrated into the vehicle are critical—that has to be done right.” The 2016 U.S. Tech Experience Index (TXI) Study is based on a survey of 17,864 vehicle owners and lessees. Awards are based solely on responses from the 13,269 consumers who purchased or leased a new 2016 model-year vehicle in the previous 90 days that has been considered an all-new or redesigned vehicle within in the past three years. The study was fielded from February through August 2016. View full article
-
New Study Reports Many New Technologies Aren't Being Used
William Maley posted an article in Automotive Industry
 Automakers are leveraging new technologies such as automatic parking systems, concierge services, and mobile internet to bring people into showrooms. But a new study done by J.D. Power reveals that a number of owners aren't using it. J.D. Power published today the 2015 Driver Interactive Vehicle Experience Report, a new study which looks at 33 tech features in vehicles and ask owners if they have ever used them. According to the report, at least 20 percent of owners have never used 16 out of the 33 features (about 48.4 percent). The top five features that owners said they never use includes, In-Vehicle Concierge Services - 43% Mobile Routers - 38% Automatic Parking Systems - 35% Heads-Up Display - 33% Built-In Apps - 32% So why do owners not use these features? A key part comes down to dealers not explaining the features, which in turn causes an increase of an owner not using it. Also, the report says that if a feature isn't activated when a vehicle is delivered, it sometimes mean an owner doesn't know it exists. “The first 30 days are critical. That first-time experience with the technology is the make-it-or-break-it stage. Automakers need to get it right the first time, or owners will simply use their own mobile device instead of the in-vehicle technology,” said Kristin Kolodge, executive director of driver interaction & HMI research at J.D. Power. Source: Automotive News (Subscription Required), J.D. Power Press Release is on Page 2 Automakers Spending Billions on Technologies That Many Consumers Don’t Use Built-in Connectivity among Least Used Technologies, Creating Lost Value WESTLAKE VILLAGE, Calif.: 25 August 2015 — Automakers are investing billions of dollars to put technologies in their cars and light trucks that are not being used by many of the owners of those vehicles, according to the J.D. Power 2015 Driver Interactive Vehicle Experience (DrIVE) Report.SM The 2015 DrIVE Report measures driver experiences with in-vehicle technology features during the first 90 days of ownership. The report finds that at least 20 percent of new-vehicle owners have never used 16 of the 33 technology features measured. The five features owners most commonly report that they “never use” are in-vehicle concierge (43%); mobile routers (38%); automatic parking systems (35%); head-up display (33%); and built-in apps (32%). There are 14 technology features that 20 percent or more of owners do not want in their next vehicle, including Apple CarPlay and Google Android Auto, in-vehicle concierge services and in-vehicle voice texting. Among Gen Y[1], the number of features unwanted by at least 20 percent of owners increases to 23, specifically technologies related to entertainment and connectivity systems. “In many cases, owners simply prefer to use their smartphone or tablet because it meets their needs; they’re familiar with the device and it’s accurate,” said Kristin Kolodge, executive director of driver interaction & HMI research at J.D. Power. “In-vehicle connectivity technology that’s not used results in millions of dollars of lost value for both consumers and the manufacturers.” Among all owners, the most frequently cited reasons for not wanting a specific technology feature in their next vehicle are “did not find it useful” in their current vehicle and the technology “came as part of a package on my current vehicle and I did not want it.” In addition, owners who say their dealer did not explain the feature have a higher likelihood of never using the technology. Furthermore, features that are not activated when the vehicle is delivered often result in the owner not even knowing they have the technology in their new vehicle. Kolodge noted that the technologies owners most often want are those that enhance the driving experience and safety, which are only available as a built-in feature rather than via an external device. In-vehicle technologies that most owners do want include vehicle health diagnostics, blind-spot warning and detection, and adaptive cruise control. “The first 30 days are critical. That first-time experience with the technology is the make-it-or-break-it stage,” said Kolodge. “Automakers need to get it right the first time, or owners will simply use their own mobile device instead of the in-vehicle technology.” Because the first few weeks of ownership are so critical, dealerships play the most important role in helping owners get off to a good start with the technology in their vehicle, Kolodge noted. “While dealers are expected to play a key role in explaining the technology to consumers, the onus should be on automakers to design the technology to be intuitive for consumers,” said Kolodge. “Automakers also need to explain the technology to dealership staff and train them on how to demonstrate it to owners.” Safety and Repair Costs Use of in-vehicle technologies has implications beyond the auto industry. For example, the insurance industry is closely tracking automotive technology for safety and financial purposes. Insurers are concerned that difficult-to-use technology may distract drivers and cause an accident. Using smartphones instead of in-vehicle technology also creates safety issues. Additionally, in-vehicle technology can significantly increase claims costs for vehicles damaged in an accident. “While some technologies, such as lane-departure warning, are making vehicles safer, the insurance industry is very concerned about the driver-distraction hazards caused by some of the other technologies,” said Chip Lackey, senior director of the insurance practice at J.D. Power. “In addition, technology drives up the repair and replacement costs. A slight bumper scrape that would normally cost a few hundred dollars to repair can catapult a claim into thousands of dollars when a park assist camera or other sensors are damaged.” The 2015 Driver Interactive Vehicle Experience (DrIVE) Report is based on responses from more than 4,200 vehicle owners and lessees after 90 days of ownership. The report was fielded in April through June 2015.
 -
Automakers are leveraging new technologies such as automatic parking systems, concierge services, and mobile internet to bring people into showrooms. But a new study done by J.D. Power reveals that a number of owners aren't using it. J.D. Power published today the 2015 Driver Interactive Vehicle Experience Report, a new study which looks at 33 tech features in vehicles and ask owners if they have ever used them. According to the report, at least 20 percent of owners have never used 16 out of the 33 features (about 48.4 percent). The top five features that owners said they never use includes, In-Vehicle Concierge Services - 43% Mobile Routers - 38% Automatic Parking Systems - 35% Heads-Up Display - 33% Built-In Apps - 32% So why do owners not use these features? A key part comes down to dealers not explaining the features, which in turn causes an increase of an owner not using it. Also, the report says that if a feature isn't activated when a vehicle is delivered, it sometimes mean an owner doesn't know it exists. “The first 30 days are critical. That first-time experience with the technology is the make-it-or-break-it stage. Automakers need to get it right the first time, or owners will simply use their own mobile device instead of the in-vehicle technology,” said Kristin Kolodge, executive director of driver interaction & HMI research at J.D. Power. Source: Automotive News (Subscription Required), J.D. Power Press Release is on Page 2 Automakers Spending Billions on Technologies That Many Consumers Don’t Use Built-in Connectivity among Least Used Technologies, Creating Lost Value WESTLAKE VILLAGE, Calif.: 25 August 2015 — Automakers are investing billions of dollars to put technologies in their cars and light trucks that are not being used by many of the owners of those vehicles, according to the J.D. Power 2015 Driver Interactive Vehicle Experience (DrIVE) Report.SM The 2015 DrIVE Report measures driver experiences with in-vehicle technology features during the first 90 days of ownership. The report finds that at least 20 percent of new-vehicle owners have never used 16 of the 33 technology features measured. The five features owners most commonly report that they “never use” are in-vehicle concierge (43%); mobile routers (38%); automatic parking systems (35%); head-up display (33%); and built-in apps (32%). There are 14 technology features that 20 percent or more of owners do not want in their next vehicle, including Apple CarPlay and Google Android Auto, in-vehicle concierge services and in-vehicle voice texting. Among Gen Y[1], the number of features unwanted by at least 20 percent of owners increases to 23, specifically technologies related to entertainment and connectivity systems. “In many cases, owners simply prefer to use their smartphone or tablet because it meets their needs; they’re familiar with the device and it’s accurate,” said Kristin Kolodge, executive director of driver interaction & HMI research at J.D. Power. “In-vehicle connectivity technology that’s not used results in millions of dollars of lost value for both consumers and the manufacturers.” Among all owners, the most frequently cited reasons for not wanting a specific technology feature in their next vehicle are “did not find it useful” in their current vehicle and the technology “came as part of a package on my current vehicle and I did not want it.” In addition, owners who say their dealer did not explain the feature have a higher likelihood of never using the technology. Furthermore, features that are not activated when the vehicle is delivered often result in the owner not even knowing they have the technology in their new vehicle. Kolodge noted that the technologies owners most often want are those that enhance the driving experience and safety, which are only available as a built-in feature rather than via an external device. In-vehicle technologies that most owners do want include vehicle health diagnostics, blind-spot warning and detection, and adaptive cruise control. “The first 30 days are critical. That first-time experience with the technology is the make-it-or-break-it stage,” said Kolodge. “Automakers need to get it right the first time, or owners will simply use their own mobile device instead of the in-vehicle technology.” Because the first few weeks of ownership are so critical, dealerships play the most important role in helping owners get off to a good start with the technology in their vehicle, Kolodge noted. “While dealers are expected to play a key role in explaining the technology to consumers, the onus should be on automakers to design the technology to be intuitive for consumers,” said Kolodge. “Automakers also need to explain the technology to dealership staff and train them on how to demonstrate it to owners.” Safety and Repair Costs Use of in-vehicle technologies has implications beyond the auto industry. For example, the insurance industry is closely tracking automotive technology for safety and financial purposes. Insurers are concerned that difficult-to-use technology may distract drivers and cause an accident. Using smartphones instead of in-vehicle technology also creates safety issues. Additionally, in-vehicle technology can significantly increase claims costs for vehicles damaged in an accident. “While some technologies, such as lane-departure warning, are making vehicles safer, the insurance industry is very concerned about the driver-distraction hazards caused by some of the other technologies,” said Chip Lackey, senior director of the insurance practice at J.D. Power. “In addition, technology drives up the repair and replacement costs. A slight bumper scrape that would normally cost a few hundred dollars to repair can catapult a claim into thousands of dollars when a park assist camera or other sensors are damaged.” The 2015 Driver Interactive Vehicle Experience (DrIVE) Report is based on responses from more than 4,200 vehicle owners and lessees after 90 days of ownership. The report was fielded in April through June 2015. View full article
-
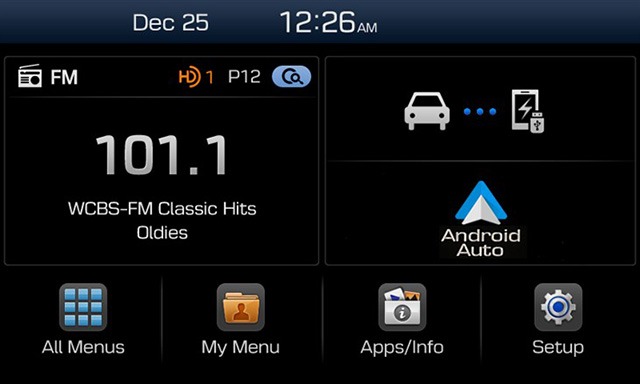
 The past few years in the automotive industry has seen an explosion in technologies - whether its dealing improving the overall safety of a vehicle or figuring out a way to hook up your smartphone. Some of the tech makes the driving experience better, while others don't. So what do consumers think about the new technologies coming into vehicles? J.D. Power decided to find out. In their 2015 US Tech Choice Study, the company asked 5,300 consumers who either bought or leased a new vehicle within the past five years about the technologies that are being put in vehicles. Their results are interesting to say in the least. For example, safety tech is a big item for consumers. 40 percent of those surveyed expressed interest in blind-spot monitoring systems, 33 percent were interested in night vision systems, and 30 percent said they were intrigued by crash mitigation systems, along with backup cameras. Was there technologies that consumers couldn't really care about. Very much so. Only nine percent on consumers wanted gesture controls and further eight percent said they wanted haptic feedback in the touchscreen. J.D. Power also asked consumers about Apple's Carplay and Android Auto, systems that allow you to use phone via the infotainment system. Unsurprisingly, preference for either system came down to what phone you had. Notably, neither system garnered high marks in the survey. "Owners of luxury vehicles tend to own iOS devices,[1] so for many luxury brands, offering Apple CarPlay may be the best option, realizing they may be leaving out a portion of the market. For non-luxury vehicle brands, the ownership of Apple and Android devices is much closer to an equal split. The solution for those brands may be to offer both operating systems and allow customers to select the option best suited for them," said Kristin Kolodge, executive director of driver interaction & HMI research at J.D. Power. Finally, J.D. Power's survey showed that Gen Y is willing to spend for tech. According to the survey results, Gen Y willing to spend an average of $3,703, followed by Gen X with an average of $3,003, and Baby Boomers spending an average of $2,416. Source: J.D. Power Press Release is on Page 2 J.D. POWER 2015 U.S. TECH CHOICE STUDY Consumer Preference for Collision Protection Technologies Paves the Way for Autonomous Driving Apple CarPlay vs. Google Android Auto? It Depends on Your Phone WESTLAKE VILLAGE, Calif.: 22 April 2015 - Three of the top five technologies consumers most prefer in their next vehicle are related to collision protection, according to the J.D. Power 2015 U.S. Tech Choice StudySM released today. Technologies that reduce the overall burden of driving and enhance the safety of the vehicle and its occupants receive the most consumer attention. Among the technologies consumers express most interest in having in their next vehicle are blind spot detection and prevention systems, night vision, and enhanced collision mitigation systems. These findings demonstrate growing customer acceptance towards the concept of the vehicle taking over critical functions such as braking and steering, which are the foundational building blocks leading to the possibility of fully-autonomous driving. The only non-collision protection technologies to crack the top five are camera rearview mirror, which falls into the driving assistance category, and self-healing paint, a comfort and convenience category. The inaugural study uses advanced statistical methodologies to measure preference for and perceived value of future and emerging technologies. A total of 59 advanced vehicle features are examined across six major categories: entertainment and connectivity; comfort and convenience; collision protection; driving assistance; navigation; and energy efficiency. "There is a tremendous interest in collision protection technologies across all generations, which creates opportunities across the market," said Kristin Kolodge, executive director of driver interaction & HMI research at J.D. Power. "In contrast, there is very little interest in energy efficiency technologies such as active shutter grille vents and solar glass roofs. Owners aren't as enthusiastic about having these technologies in their next vehicle because of other efforts automakers are taking to improve fuel economy, as well as relatively low fuel prices at the present time." Apple CarPlay vs. Google Android Auto Smartphones play an increasingly vital role in everyday life, and vehicle technology is beginning to mirror what is offered on those devices, yet Apple CarPlay and Google Android Auto technologies consistently have among the lowest preference scores across all generations. Consumer preferences for Apple CarPlay and Android Auto are uniquely dependent on which smartphone they own. Those who currently own a smartphone that is compatible with one of these technologies would choose the technology compatible with their phone at only a moderate rate, while those with the opposite brand of smartphone will rarely, if ever, choose that technology. For example, Android owners indicate that Apple CarPlay is "unacceptable" nearly twice as often as they indicate that solar glass roof is unacceptable. Similarly, Apple phone owners indicate that Android Auto is "unacceptable" nearly twice as often as solar glass roof. Kolodge noted that "lukewarm interest in these technologies that connect your phone to your vehicle coupled with consumer loyalty to their phone poses a unique challenge for automakers, which could be remedied by knowing their customers' phone preferences." "Owners of luxury vehicles tend to own iOS devices,[1] so for many luxury brands, offering Apple CarPlay may be the best option, realizing they may be leaving out a portion of the market," said Kolodge. "For non-luxury vehicle brands, the ownership of Apple and Android devices is much closer to an equal split. The solution for those brands may be to offer both operating systems and allow customers to select the option best suited for them." Gen Y Willing to Spend Most for Technology Across all generations[2], price is the most important consideration for technology, accounting for 25.2 percent of importance. Gen Y is the least sensitive to technology price and shows a greater willingness to spend on new technologies than the other generations. Gen Y consumers, who have accounted for 27.7 percent of new-vehicle sales thus far in 2015[3]-second only to Boomers at 37.1 percent-are willing to spend an average of $3,703 on technology for their next vehicle. Gen X is willing to spend $3,007, while Boomers, who show the greatest price sensitivity, and Pre-Boomers are willing to spend only $2,416 and $2,067, respectively. Importance of Technology A certainty in the automotive domain is the impact the consumer electronics world has had upon it. From shifting consumer expectations of user interaction, to the rapid pace of technology introduction and importance of keeping software up to date, to the miniaturization and creation of cost-effective solutions for sensors and cameras, "the auto industry is standing on its head to keep technology up to consumers' new standards," said Kolodge. "Those who haven't done so have seen negative feedback from consumers." KEY FINDINGS Full self-driving automation technology, part of the collision protection category, is designed to perform all safety-critical driving functions and monitor roadway conditions. The younger generations (Gen Y and Gen X) have substantially higher preference for the technology than the older generations (Boomer and Pre-Boomer). The Pre-Boomer generation, in contrast, has a greater preference for lower levels of automation, such as traffic jam assist. ŸBlind spot detection and prevention has high preference across the range of vehicle price segments. In contrast, reverse auto braking systems have low preference across the vehicle price segments and preference wanes as vehicle prices increase. ŸAdvanced sensor technologies, such as hand gesture controlled seats, biometric driver sensors or haptic touch screens have low preference. ŸTechnologies in the navigation category have low preference across all vehicle price segments. The 2015 U.S. Tech Choice Study was fielded in January through March 2015 and is based on an online survey of more than 5,300 consumers who purchased/leased a new vehicle in the past five years.
 -
The past few years in the automotive industry has seen an explosion in technologies - whether its dealing improving the overall safety of a vehicle or figuring out a way to hook up your smartphone. Some of the tech makes the driving experience better, while others don't. So what do consumers think about the new technologies coming into vehicles? J.D. Power decided to find out. In their 2015 US Tech Choice Study, the company asked 5,300 consumers who either bought or leased a new vehicle within the past five years about the technologies that are being put in vehicles. Their results are interesting to say in the least. For example, safety tech is a big item for consumers. 40 percent of those surveyed expressed interest in blind-spot monitoring systems, 33 percent were interested in night vision systems, and 30 percent said they were intrigued by crash mitigation systems, along with backup cameras. Was there technologies that consumers couldn't really care about. Very much so. Only nine percent on consumers wanted gesture controls and further eight percent said they wanted haptic feedback in the touchscreen. J.D. Power also asked consumers about Apple's Carplay and Android Auto, systems that allow you to use phone via the infotainment system. Unsurprisingly, preference for either system came down to what phone you had. Notably, neither system garnered high marks in the survey. "Owners of luxury vehicles tend to own iOS devices,[1] so for many luxury brands, offering Apple CarPlay may be the best option, realizing they may be leaving out a portion of the market. For non-luxury vehicle brands, the ownership of Apple and Android devices is much closer to an equal split. The solution for those brands may be to offer both operating systems and allow customers to select the option best suited for them," said Kristin Kolodge, executive director of driver interaction & HMI research at J.D. Power. Finally, J.D. Power's survey showed that Gen Y is willing to spend for tech. According to the survey results, Gen Y willing to spend an average of $3,703, followed by Gen X with an average of $3,003, and Baby Boomers spending an average of $2,416. Source: J.D. Power Press Release is on Page 2 J.D. POWER 2015 U.S. TECH CHOICE STUDY Consumer Preference for Collision Protection Technologies Paves the Way for Autonomous Driving Apple CarPlay vs. Google Android Auto? It Depends on Your Phone WESTLAKE VILLAGE, Calif.: 22 April 2015 - Three of the top five technologies consumers most prefer in their next vehicle are related to collision protection, according to the J.D. Power 2015 U.S. Tech Choice StudySM released today. Technologies that reduce the overall burden of driving and enhance the safety of the vehicle and its occupants receive the most consumer attention. Among the technologies consumers express most interest in having in their next vehicle are blind spot detection and prevention systems, night vision, and enhanced collision mitigation systems. These findings demonstrate growing customer acceptance towards the concept of the vehicle taking over critical functions such as braking and steering, which are the foundational building blocks leading to the possibility of fully-autonomous driving. The only non-collision protection technologies to crack the top five are camera rearview mirror, which falls into the driving assistance category, and self-healing paint, a comfort and convenience category. The inaugural study uses advanced statistical methodologies to measure preference for and perceived value of future and emerging technologies. A total of 59 advanced vehicle features are examined across six major categories: entertainment and connectivity; comfort and convenience; collision protection; driving assistance; navigation; and energy efficiency. "There is a tremendous interest in collision protection technologies across all generations, which creates opportunities across the market," said Kristin Kolodge, executive director of driver interaction & HMI research at J.D. Power. "In contrast, there is very little interest in energy efficiency technologies such as active shutter grille vents and solar glass roofs. Owners aren't as enthusiastic about having these technologies in their next vehicle because of other efforts automakers are taking to improve fuel economy, as well as relatively low fuel prices at the present time." Apple CarPlay vs. Google Android Auto Smartphones play an increasingly vital role in everyday life, and vehicle technology is beginning to mirror what is offered on those devices, yet Apple CarPlay and Google Android Auto technologies consistently have among the lowest preference scores across all generations. Consumer preferences for Apple CarPlay and Android Auto are uniquely dependent on which smartphone they own. Those who currently own a smartphone that is compatible with one of these technologies would choose the technology compatible with their phone at only a moderate rate, while those with the opposite brand of smartphone will rarely, if ever, choose that technology. For example, Android owners indicate that Apple CarPlay is "unacceptable" nearly twice as often as they indicate that solar glass roof is unacceptable. Similarly, Apple phone owners indicate that Android Auto is "unacceptable" nearly twice as often as solar glass roof. Kolodge noted that "lukewarm interest in these technologies that connect your phone to your vehicle coupled with consumer loyalty to their phone poses a unique challenge for automakers, which could be remedied by knowing their customers' phone preferences." "Owners of luxury vehicles tend to own iOS devices,[1] so for many luxury brands, offering Apple CarPlay may be the best option, realizing they may be leaving out a portion of the market," said Kolodge. "For non-luxury vehicle brands, the ownership of Apple and Android devices is much closer to an equal split. The solution for those brands may be to offer both operating systems and allow customers to select the option best suited for them." Gen Y Willing to Spend Most for Technology Across all generations[2], price is the most important consideration for technology, accounting for 25.2 percent of importance. Gen Y is the least sensitive to technology price and shows a greater willingness to spend on new technologies than the other generations. Gen Y consumers, who have accounted for 27.7 percent of new-vehicle sales thus far in 2015[3]-second only to Boomers at 37.1 percent-are willing to spend an average of $3,703 on technology for their next vehicle. Gen X is willing to spend $3,007, while Boomers, who show the greatest price sensitivity, and Pre-Boomers are willing to spend only $2,416 and $2,067, respectively. Importance of Technology A certainty in the automotive domain is the impact the consumer electronics world has had upon it. From shifting consumer expectations of user interaction, to the rapid pace of technology introduction and importance of keeping software up to date, to the miniaturization and creation of cost-effective solutions for sensors and cameras, "the auto industry is standing on its head to keep technology up to consumers' new standards," said Kolodge. "Those who haven't done so have seen negative feedback from consumers." KEY FINDINGS Full self-driving automation technology, part of the collision protection category, is designed to perform all safety-critical driving functions and monitor roadway conditions. The younger generations (Gen Y and Gen X) have substantially higher preference for the technology than the older generations (Boomer and Pre-Boomer). The Pre-Boomer generation, in contrast, has a greater preference for lower levels of automation, such as traffic jam assist. ŸBlind spot detection and prevention has high preference across the range of vehicle price segments. In contrast, reverse auto braking systems have low preference across the vehicle price segments and preference wanes as vehicle prices increase. ŸAdvanced sensor technologies, such as hand gesture controlled seats, biometric driver sensors or haptic touch screens have low preference. ŸTechnologies in the navigation category have low preference across all vehicle price segments. The 2015 U.S. Tech Choice Study was fielded in January through March 2015 and is based on an online survey of more than 5,300 consumers who purchased/leased a new vehicle in the past five years. View full article
-
Problems With New Cars Increase For The Time Since 1998
William Maley posted an article in Automotive Industry
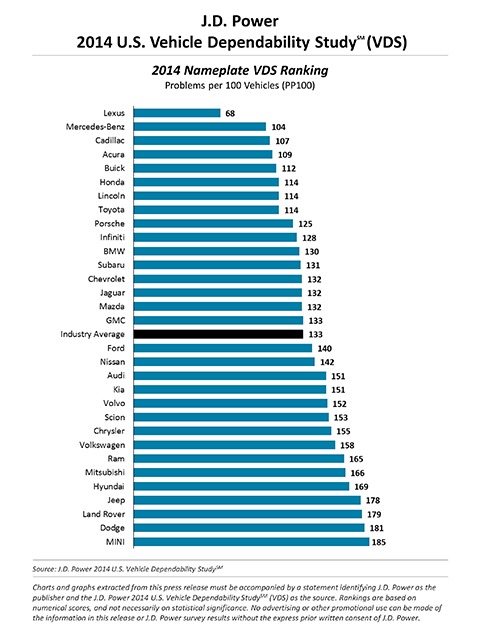 For the first time in sixteen years, J.D. Power and Associates says data from its recent vehicle dependability study shows that the average number of problems per 100 cars has increased. This year's study charted 2011 models over three years of ownership and tracked the number of problems. Looking at first-owner cars from the 2011 model year, J.D. Power reports an average of 133 problems per 100 cars (or shorten to PP100). This is an increase of six percent when compared to 2010's 126 PP100 average. The reason for this climb in problems comes down to problems with engines and transmissions. J.D. Power found that engines and transmissions problem accounted for a 6 PP100 boost. "Automakers are continually looking for ways to improve fuel economy, which is a primary purchase motivator for many consumers, particularly those buying smaller vehicles. However, while striving to reduce fuel consumption, automakers must be careful not to compromise quality. Increases in such problems as engine hesitation, rough transmission shifts and lack of power indicate that this is a continuing challenge," said David Sargent, vice president of global automotive at J.D. Power. Among individual brands, Lexus ran away with the most dependable brand title for the third year in a row. With just 68 problems per 100 vehicles, the brand was far ahead of Mercedes-Benz (104 PP100), Cadillac (107 PP100), Acura (109 PP100), and Buick (112 PP100). Source: J.D. Power William Maley is a staff writer for Cheers & Gears. He can be reached at [email protected] you can follow him on twitter at @realmudmonster. Press Release is on Page 2 2014 Vehicle Dependability Study 2/12/2014 J.D. Power Reports: Increased Engine and Transmission Problems Contribute to Decline in Vehicle Dependability for The First Time in More Than 15 Years General Motors Company Receives Eight Segment Awards, While Toyota Motor Corporation Garners Seven and Honda Motor Company Earns Six WESTLAKE VILLAGE, Calif.: Owners of 3-year-old vehicles (2011 model year) report more problems than did owners of 3-year-old vehicles last year, according to the J.D. Power 2014 U.S. Vehicle Dependability StudySM (VDS) released today. The study, now in its 25th year, examines problems experienced during the past 12 months by original owners of 2011 model-year vehicles. Overall dependability is determined by the number of problems experienced per 100 vehicles (PP100), with a lower score reflecting higher quality. The study finds that overall vehicle dependability averages 133 PP100, a 6 percent increase in problems from 126 PP100 in 2013. This marks the first time since the 1998 study that the average number of problems has increased. "Until this year, we have seen a continual improvement in vehicle dependability," said David Sargent, vice president of global automotive at J.D. Power. "However, some of the changes that automakers implemented for the 2011 model year have led to a noticeable increase in problems reported." Increases in Engine and Transmission Problems Reported Engine and transmission problems increase by nearly 6 PP100 year over year, accounting for the majority of the overall 7 PP100 increase in reported problems. The decline in quality is particularly acute for vehicles with 4-cylinder engines, where problem levels increase by nearly 10 PP100. These smaller engines, as well as large diesel engines, tend to be more problematic than 5- and 6-cylinder engines, for which owners report fewer problems, on average. "Automakers are continually looking for ways to improve fuel economy, which is a primary purchase motivator for many consumers, particularly those buying smaller vehicles," said Sargent. "However, while striving to reduce fuel consumption, automakers must be careful not to compromise quality. Increases in such problems as engine hesitation, rough transmission shifts and lack of power indicate that this is a continuing challenge." Dependability Leads to Loyalty; Poor Dependability Creates Avoidance J.D. Power also finds that the fewer problems owners experience with their vehicle, the greater their loyalty to the brand. Combined data from previous years' VDS results and vehicle trade-in data from the Power Information Network® (PIN) from J.D. Power show that 56 percent of owners who reported no problems stayed with the same brand when they purchased their next new vehicle. Brand loyalty slipped to just 42 percent among owners who reported three or more problems. Also, a comparison of data from the 2013 Vehicle Dependability Study with data from the subsequent J.D. Power 2014 U.S. Avoider StudySM shows that consumers are much more likely to avoid vehicles from brands that rank lower in dependability. On average, 23 percent of consumers avoided brands that ranked in the lowest quartile of the 2013 VDS because of concerns about reliability. In contrast, only 9 percent of consumers cited that same reason for avoiding brands that ranked in the top quartile. "By combining our customer research with trade-in data, we see a very strong correlation between dependability and real-world brand loyalty," said Sargent. "Also, we see that brands with lower dependability are likely to be shut out of a significant piece of the market, as many consumers will not even consider purchasing one of their vehicles because of concerns about its likely reliability." Highest-Ranked Nameplates and Models Lexus ranks highest in vehicle dependability among all nameplates for a third consecutive year. The gap between Lexus and all other brands is substantial, with Lexus averaging 68 PP100 compared with second-ranked Mercedes-Benz at 104 PP100. Following Mercedes-Benz in the rankings are Cadillac (107), Acura (109) and Buick (112), respectively. General Motors Company receives eight segment awards?more than any other automaker in 2014?for the Buick Lucerne; Cadillac DTS (tie); Cadillac Escalade; Chevrolet Camaro; Chevrolet Volt; GMC Sierra HD; GMC Sierra LD; and GMC Yukon. Toyota Motor Corporation garners seven awards for the Lexus ES; Lexus GS; Lexus LS (tie); Lexus RX; Scion xB; Toyota Camry; and Toyota Sienna. Honda Motor Company receives six model-level awards for the Acura RDX; Honda CR-V; Honda Crosstour; Honda Element; Honda Fit; and Honda Ridgeline. MINI receives one model-level award for the MINI Cooper. The Vehicle Dependability Study is used extensively by manufacturers and suppliers worldwide to help them design and build better vehicles, which typically translates into higher resale values and customer loyalty. It also helps consumers make more-informed choices for both new- and used-vehicle purchases. The 2014 Vehicle Dependability Study is based on responses from more than 41,000 original owners of 2011 model-year vehicles after three years of ownership. The study was fielded between October and December 2013.
 -
For the first time in sixteen years, J.D. Power and Associates says data from its recent vehicle dependability study shows that the average number of problems per 100 cars has increased. This year's study charted 2011 models over three years of ownership and tracked the number of problems. Looking at first-owner cars from the 2011 model year, J.D. Power reports an average of 133 problems per 100 cars (or shorten to PP100). This is an increase of six percent when compared to 2010's 126 PP100 average. The reason for this climb in problems comes down to problems with engines and transmissions. J.D. Power found that engines and transmissions problem accounted for a 6 PP100 boost. "Automakers are continually looking for ways to improve fuel economy, which is a primary purchase motivator for many consumers, particularly those buying smaller vehicles. However, while striving to reduce fuel consumption, automakers must be careful not to compromise quality. Increases in such problems as engine hesitation, rough transmission shifts and lack of power indicate that this is a continuing challenge," said David Sargent, vice president of global automotive at J.D. Power. Among individual brands, Lexus ran away with the most dependable brand title for the third year in a row. With just 68 problems per 100 vehicles, the brand was far ahead of Mercedes-Benz (104 PP100), Cadillac (107 PP100), Acura (109 PP100), and Buick (112 PP100). Source: J.D. Power William Maley is a staff writer for Cheers & Gears. He can be reached at [email protected] you can follow him on twitter at @realmudmonster. Press Release is on Page 2 2014 Vehicle Dependability Study 2/12/2014 J.D. Power Reports: Increased Engine and Transmission Problems Contribute to Decline in Vehicle Dependability for The First Time in More Than 15 Years General Motors Company Receives Eight Segment Awards, While Toyota Motor Corporation Garners Seven and Honda Motor Company Earns Six WESTLAKE VILLAGE, Calif.: Owners of 3-year-old vehicles (2011 model year) report more problems than did owners of 3-year-old vehicles last year, according to the J.D. Power 2014 U.S. Vehicle Dependability StudySM (VDS) released today. The study, now in its 25th year, examines problems experienced during the past 12 months by original owners of 2011 model-year vehicles. Overall dependability is determined by the number of problems experienced per 100 vehicles (PP100), with a lower score reflecting higher quality. The study finds that overall vehicle dependability averages 133 PP100, a 6 percent increase in problems from 126 PP100 in 2013. This marks the first time since the 1998 study that the average number of problems has increased. "Until this year, we have seen a continual improvement in vehicle dependability," said David Sargent, vice president of global automotive at J.D. Power. "However, some of the changes that automakers implemented for the 2011 model year have led to a noticeable increase in problems reported." Increases in Engine and Transmission Problems Reported Engine and transmission problems increase by nearly 6 PP100 year over year, accounting for the majority of the overall 7 PP100 increase in reported problems. The decline in quality is particularly acute for vehicles with 4-cylinder engines, where problem levels increase by nearly 10 PP100. These smaller engines, as well as large diesel engines, tend to be more problematic than 5- and 6-cylinder engines, for which owners report fewer problems, on average. "Automakers are continually looking for ways to improve fuel economy, which is a primary purchase motivator for many consumers, particularly those buying smaller vehicles," said Sargent. "However, while striving to reduce fuel consumption, automakers must be careful not to compromise quality. Increases in such problems as engine hesitation, rough transmission shifts and lack of power indicate that this is a continuing challenge." Dependability Leads to Loyalty; Poor Dependability Creates Avoidance J.D. Power also finds that the fewer problems owners experience with their vehicle, the greater their loyalty to the brand. Combined data from previous years' VDS results and vehicle trade-in data from the Power Information Network® (PIN) from J.D. Power show that 56 percent of owners who reported no problems stayed with the same brand when they purchased their next new vehicle. Brand loyalty slipped to just 42 percent among owners who reported three or more problems. Also, a comparison of data from the 2013 Vehicle Dependability Study with data from the subsequent J.D. Power 2014 U.S. Avoider StudySM shows that consumers are much more likely to avoid vehicles from brands that rank lower in dependability. On average, 23 percent of consumers avoided brands that ranked in the lowest quartile of the 2013 VDS because of concerns about reliability. In contrast, only 9 percent of consumers cited that same reason for avoiding brands that ranked in the top quartile. "By combining our customer research with trade-in data, we see a very strong correlation between dependability and real-world brand loyalty," said Sargent. "Also, we see that brands with lower dependability are likely to be shut out of a significant piece of the market, as many consumers will not even consider purchasing one of their vehicles because of concerns about its likely reliability." Highest-Ranked Nameplates and Models Lexus ranks highest in vehicle dependability among all nameplates for a third consecutive year. The gap between Lexus and all other brands is substantial, with Lexus averaging 68 PP100 compared with second-ranked Mercedes-Benz at 104 PP100. Following Mercedes-Benz in the rankings are Cadillac (107), Acura (109) and Buick (112), respectively. General Motors Company receives eight segment awards?more than any other automaker in 2014?for the Buick Lucerne; Cadillac DTS (tie); Cadillac Escalade; Chevrolet Camaro; Chevrolet Volt; GMC Sierra HD; GMC Sierra LD; and GMC Yukon. Toyota Motor Corporation garners seven awards for the Lexus ES; Lexus GS; Lexus LS (tie); Lexus RX; Scion xB; Toyota Camry; and Toyota Sienna. Honda Motor Company receives six model-level awards for the Acura RDX; Honda CR-V; Honda Crosstour; Honda Element; Honda Fit; and Honda Ridgeline. MINI receives one model-level award for the MINI Cooper. The Vehicle Dependability Study is used extensively by manufacturers and suppliers worldwide to help them design and build better vehicles, which typically translates into higher resale values and customer loyalty. It also helps consumers make more-informed choices for both new- and used-vehicle purchases. The 2014 Vehicle Dependability Study is based on responses from more than 41,000 original owners of 2011 model-year vehicles after three years of ownership. The study was fielded between October and December 2013. View full article
-
By William Maley Staff Writer - CheersandGears.com January 31, 2013 J.D. Power and Associates recently released their 2012 U.S. Navigation Usage Satisfaction Study and the results aren’t that surprising. Consumer happiness dropped 13 points in the study’s 1,000-point scale to 681, one of the lowest scores J.D. Power has ever recorded in the six years the study has been taken. Even worse was the overall satisfaction in voice controls, scoring 544 points out of 1,000. Even worse news for automakers: people are using their smartphones for navigation and point-of-interest searches.47% of the people surveyed had downloaded a navigation app to supplement their in-car system, up from 37% last year. The survey also revealed that owners “definitely would not” or “probably would not” buy the system in their vehicles if their smartphone’s navigation could be displayed on the screen. “Manufacturers of navigation systems face a serious challenge as smartphone navigation usage continues to rise and gains preference among vehicle owners. Free apps, up-to-date maps, and a familiar interface allow for quicker routing and improved interaction, including better voice recognition,” said Mike VanNieuwkuyk, executive director of global automotive at J.D. Power. Source: Wired Autopia William Maley is a staff writer for Cheers & Gears. He can be reached at [email protected] or you can follow him on twitter at @realmudmonster. View full article
-
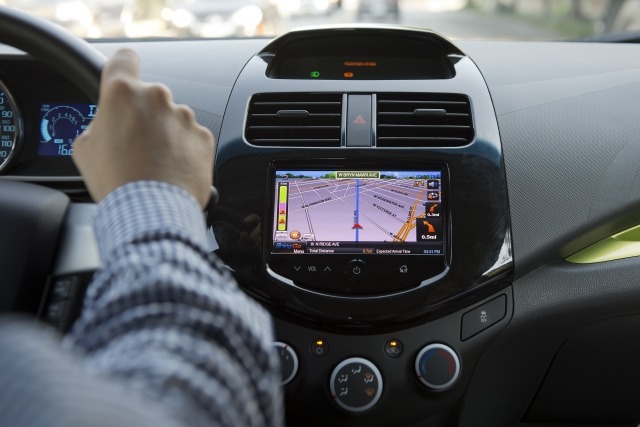 By William Maley Staff Writer - CheersandGears.com January 31, 2013 J.D. Power and Associates recently released their 2012 U.S. Navigation Usage Satisfaction Study and the results aren’t that surprising. Consumer happiness dropped 13 points in the study’s 1,000-point scale to 681, one of the lowest scores J.D. Power has ever recorded in the six years the study has been taken. Even worse was the overall satisfaction in voice controls, scoring 544 points out of 1,000. Even worse news for automakers: people are using their smartphones for navigation and point-of-interest searches.47% of the people surveyed had downloaded a navigation app to supplement their in-car system, up from 37% last year. The survey also revealed that owners “definitely would not” or “probably would not” buy the system in their vehicles if their smartphone’s navigation could be displayed on the screen. “Manufacturers of navigation systems face a serious challenge as smartphone navigation usage continues to rise and gains preference among vehicle owners. Free apps, up-to-date maps, and a familiar interface allow for quicker routing and improved interaction, including better voice recognition,” said Mike VanNieuwkuyk, executive director of global automotive at J.D. Power. Source: Wired Autopia William Maley is a staff writer for Cheers & Gears. He can be reached at [email protected] or you can follow him on twitter at @realmudmonster.
